The analysis of a model can produce a list of issues. Each issue is a part of the DAX code with an anti-pattern that could have a negative impact on the performance of the model.
To maximize your productivity, use the following approach:
- Run a model analysis.
- Evaluate the issues with higher priorities.
- Fix the issues in the measures affected by high-relevance issues
- Evaluate the performance of critical reports.
- Repeat the process until you are satisfied with the overall performance.
Reaching a zero-issues state for a model is not the primary goal of DAX Optimizer. The goal is to maximize the performance improvement with the minimal effort of DAX code refactoring. However, if you use DAX Optimizer to keep the model in good shape, then you should keep the model with zero issues by running frequent analyses with DAX Optimizer.
There are different options to evaluate the issues and decide what to do.
This section describes the available possibilities.
Measures and issues
Each measure can have multiple issues. Each issue has a type and a state:
- The type is the anti-pattern that has been detected.
- The state is the status of the issue and can be: Open, Fixed, or Ignored.
While reviewing an issue you can:
- Fix issue. An issue is fixed by changing the DAX code of the measure, and you can then mark the issue as fixed.
- Ignore issue. By marking an issue as ignored it will be hidden during subsequent analyses of the model if the measure has the same fingerprint.
Analyzing by issue
The Issues tab shows the list of issues in the model.
The analysis by issue is useful when you want to:
- Fix all the measures with similar issues.
- Quickly set the state of fixed and ignored issues
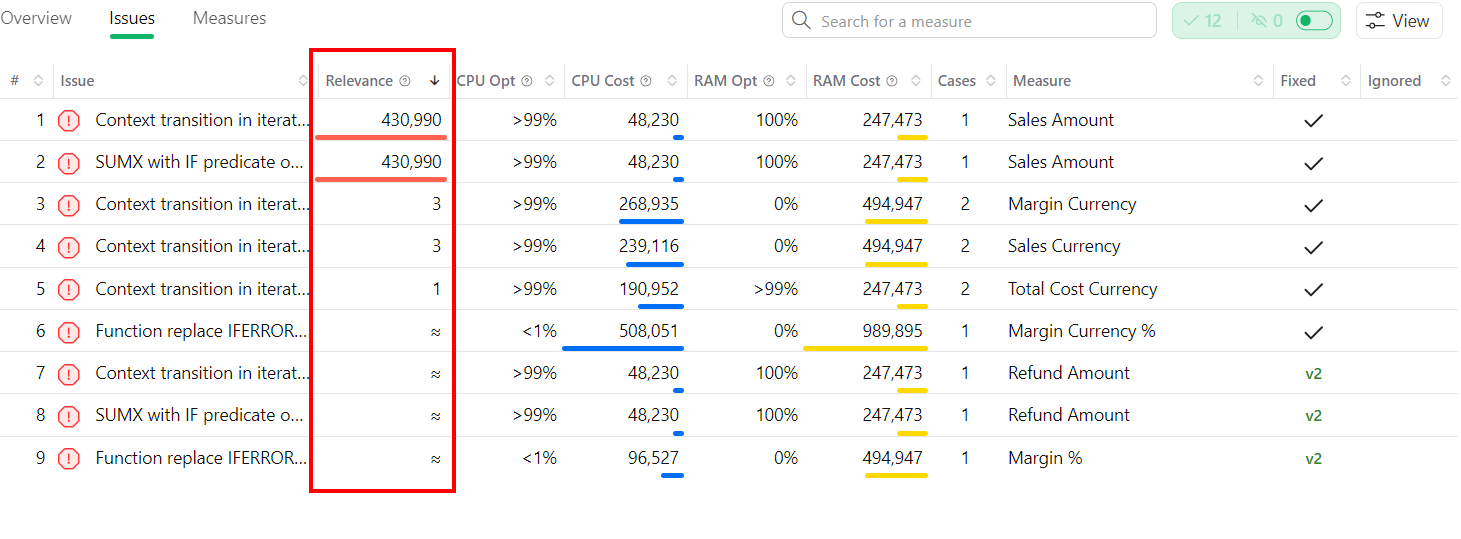
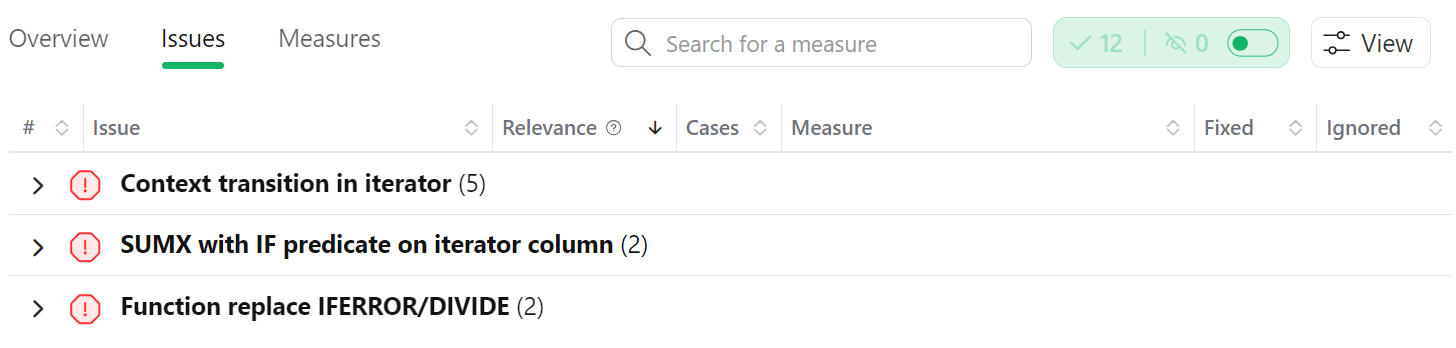
Issues not grouped
By default, the visualization shows issues not grouped: each row on the Issues page shows an issue in a measure.
By default, issues are ordered by the most relevant.
To change that, click on each column. For example, you can decide to order issues for the one with the maximum CPU cost.
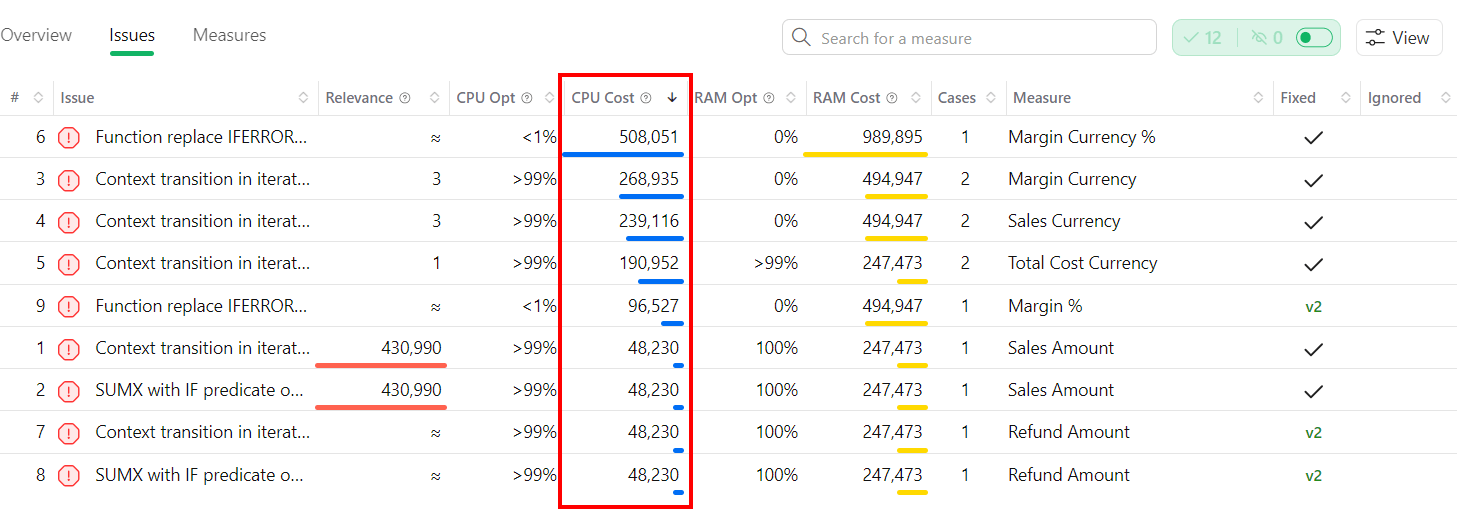
NOTE: To display the CPU Cost metric and the other advanced metrics, click on View > Expert View.
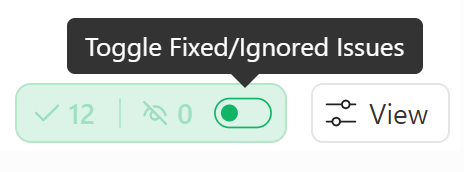
To display or hide Fixed or Ignored issues, manage the dedicated toggle.
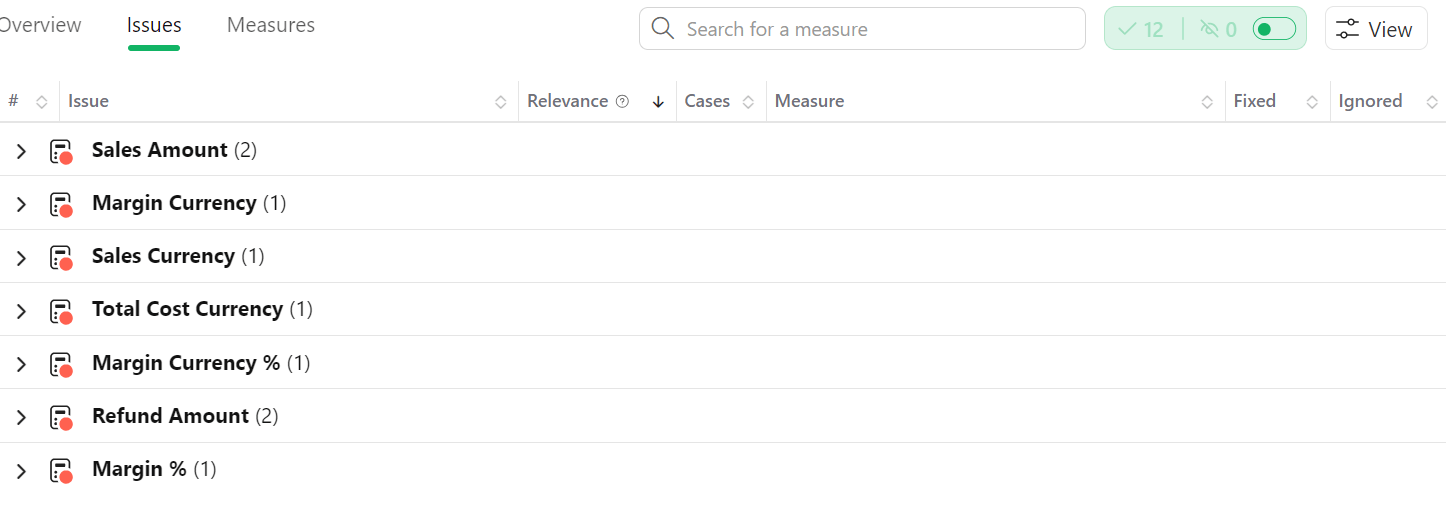
Grouping issues
Issues can be grouped by:
- Issue. Each row shows an issue type with the number of measures that have at least one issue of that type.
- Measure. Each row shows a measure with the number of issue types found in the measure
To choose a grouping method, click on View then:
- Measure to group by measure.
- Issue to group by measure.
- (None) to leave the default visualization (issues not grouped).
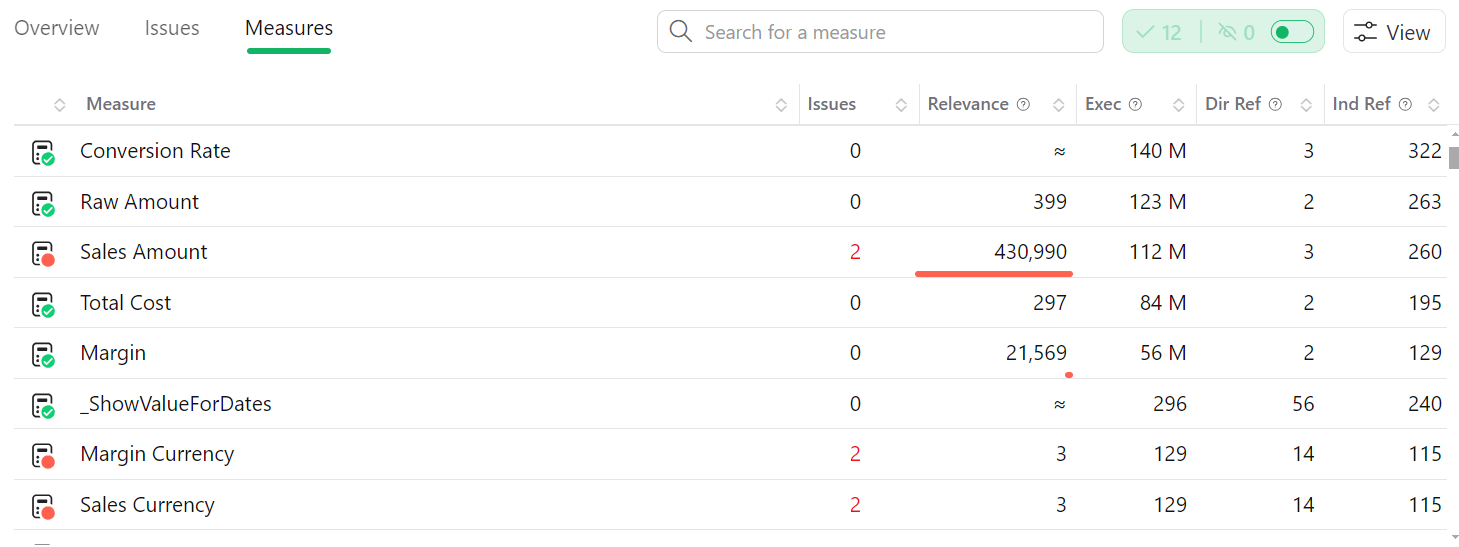
Analyzing by measure
If time is limited and you want to fix the more expensive measures first, you can use the analysis by measure.
The Measures page shows the list of measures in the model.
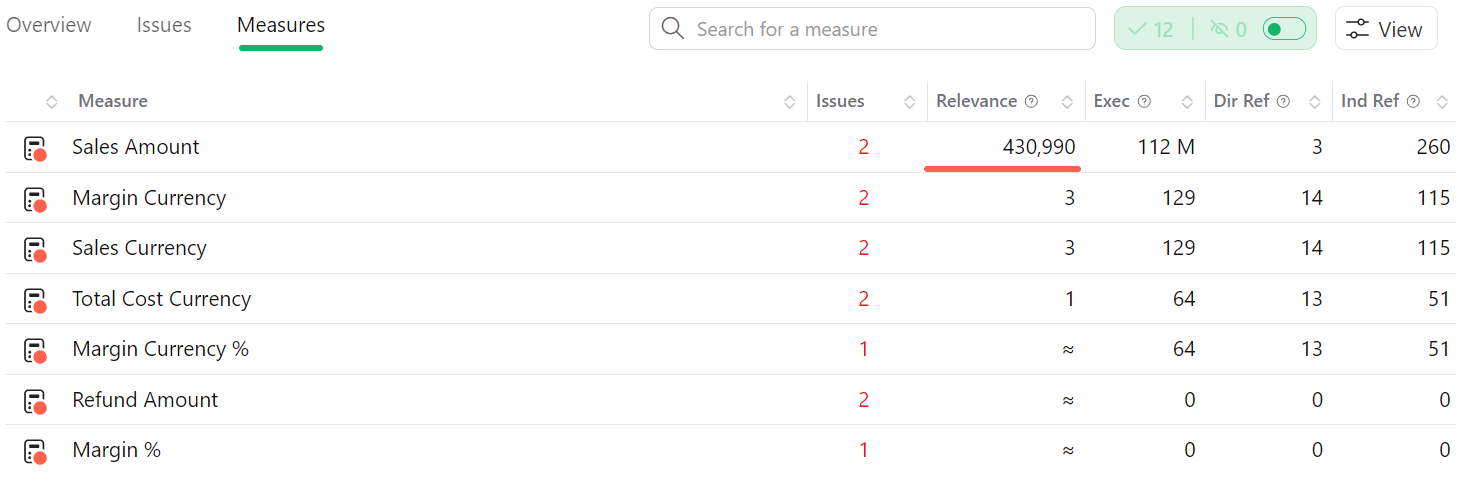
Each row shows the status of the measure, the number of issues, and additional metrics to evaluate the importance of the measures from an optimization perspective.
You can use all the filtering shown in the previous section, including the Expert View**.
The only difference, in this case, is that measures can only be grouped per issue. To do so, click on View > Issues only. When you do so, DAX Optimizer displays the measures that have open issues. If you don’t use this grouping method, DAX Optimizer will display all the measures (even the ones with no issues).