NOTE: When you have a valid account, you can test DAX Optimizer without activating any license using the sample models.
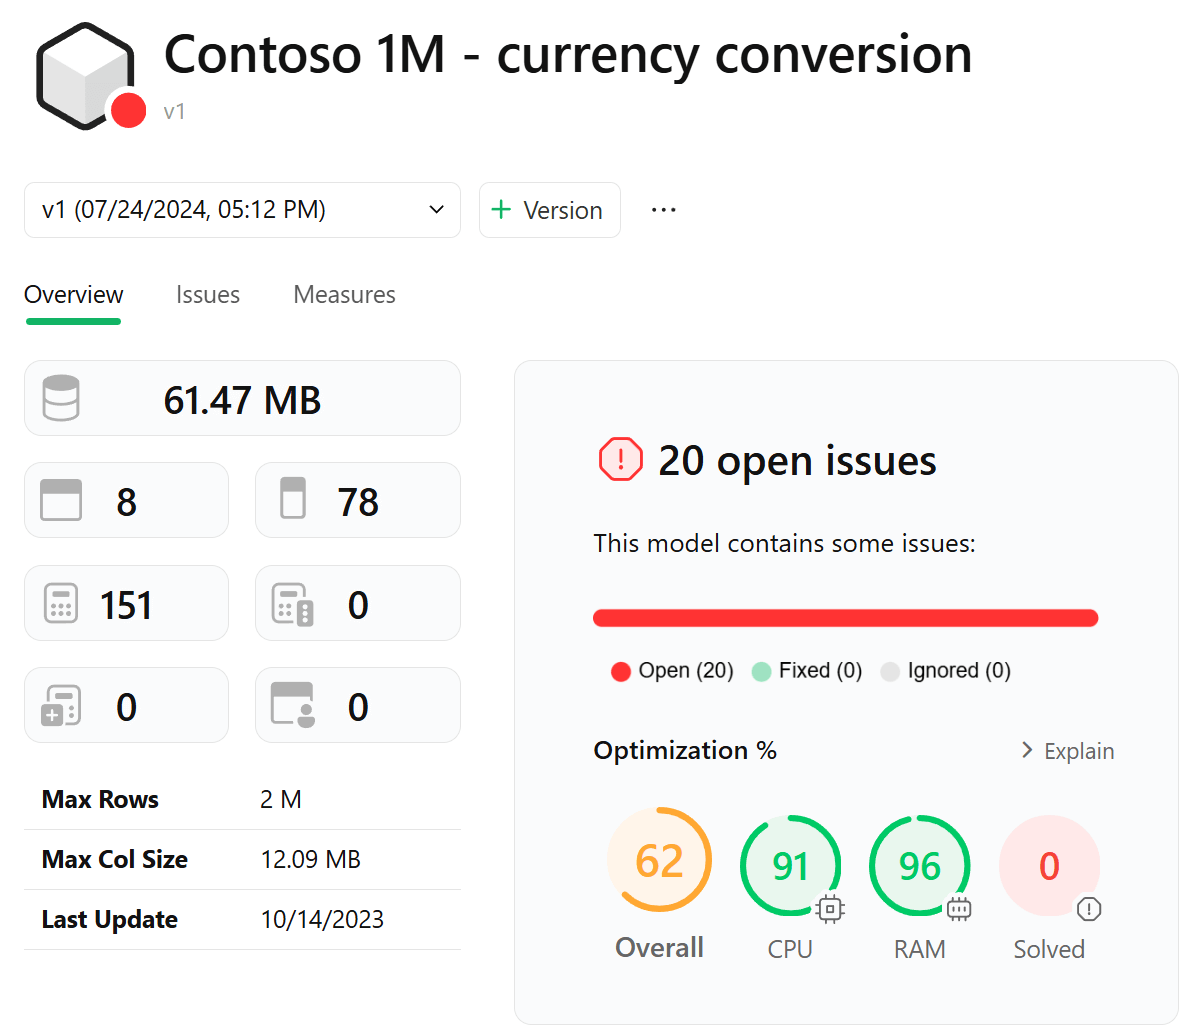
Start the analysis using the model Contoso 1M - currency conversion in the Sample Walkthrough workspace.
The Overview page shows the issues found by DAX Optimizer in the file.
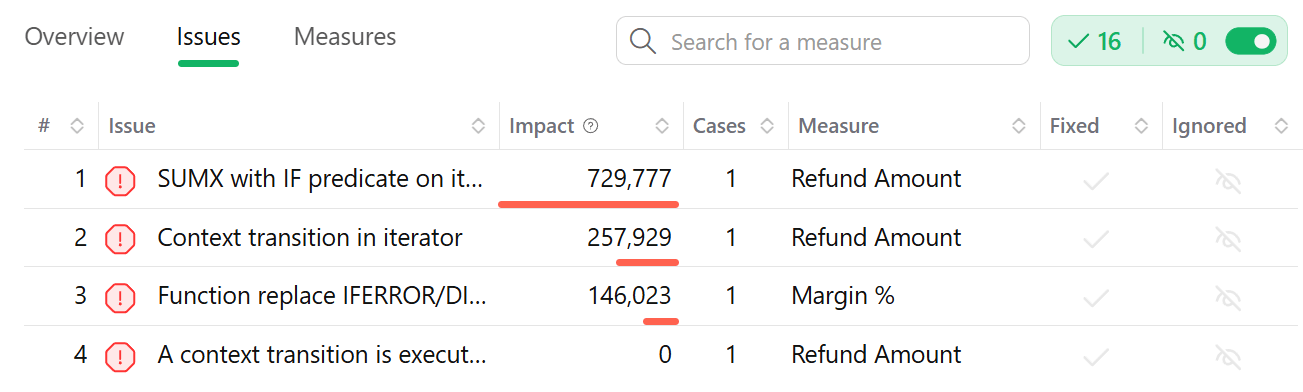
The Issues page shows the list of issues detected.
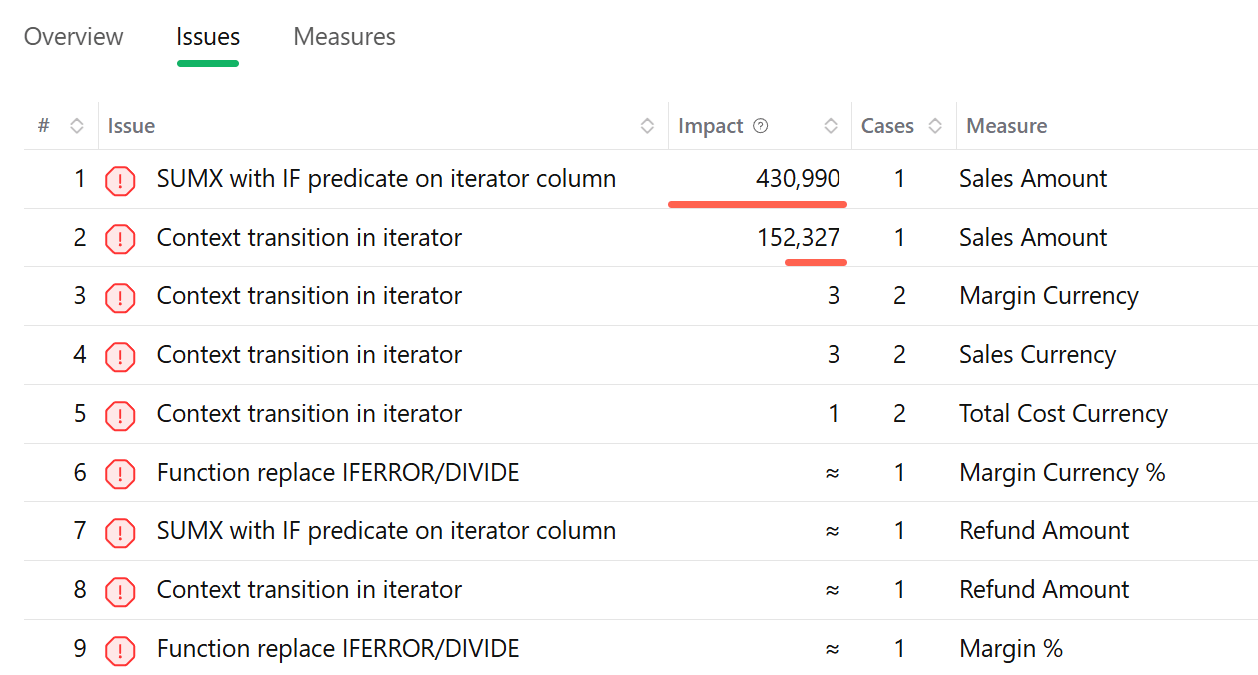
DAX Optimizer sorts issues by Impact as a default. These are the ones that have a higher impact on the performance of the model.
The Measures page shows the list of all the measures in the model. The measures affected by an issue are displayed with a red dot.
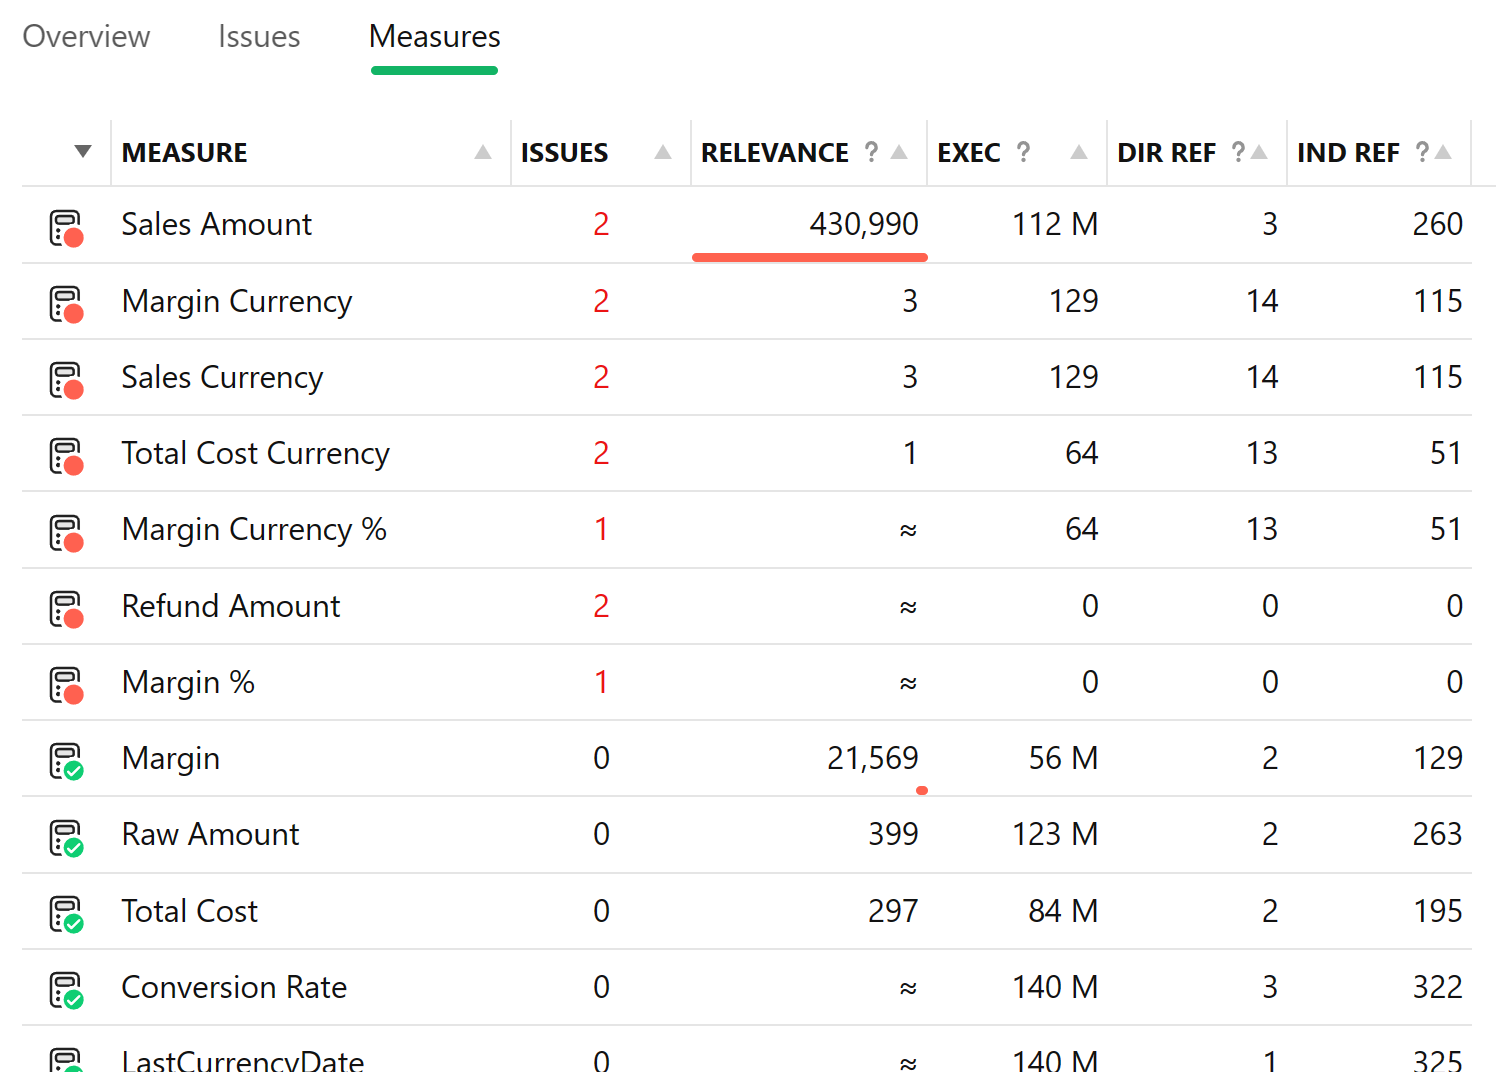
The default sort order of the measures is by Relevance, which represents the overall cost of the measure on the model. In this particular case, the measure with the highest cost is Sales Amount.
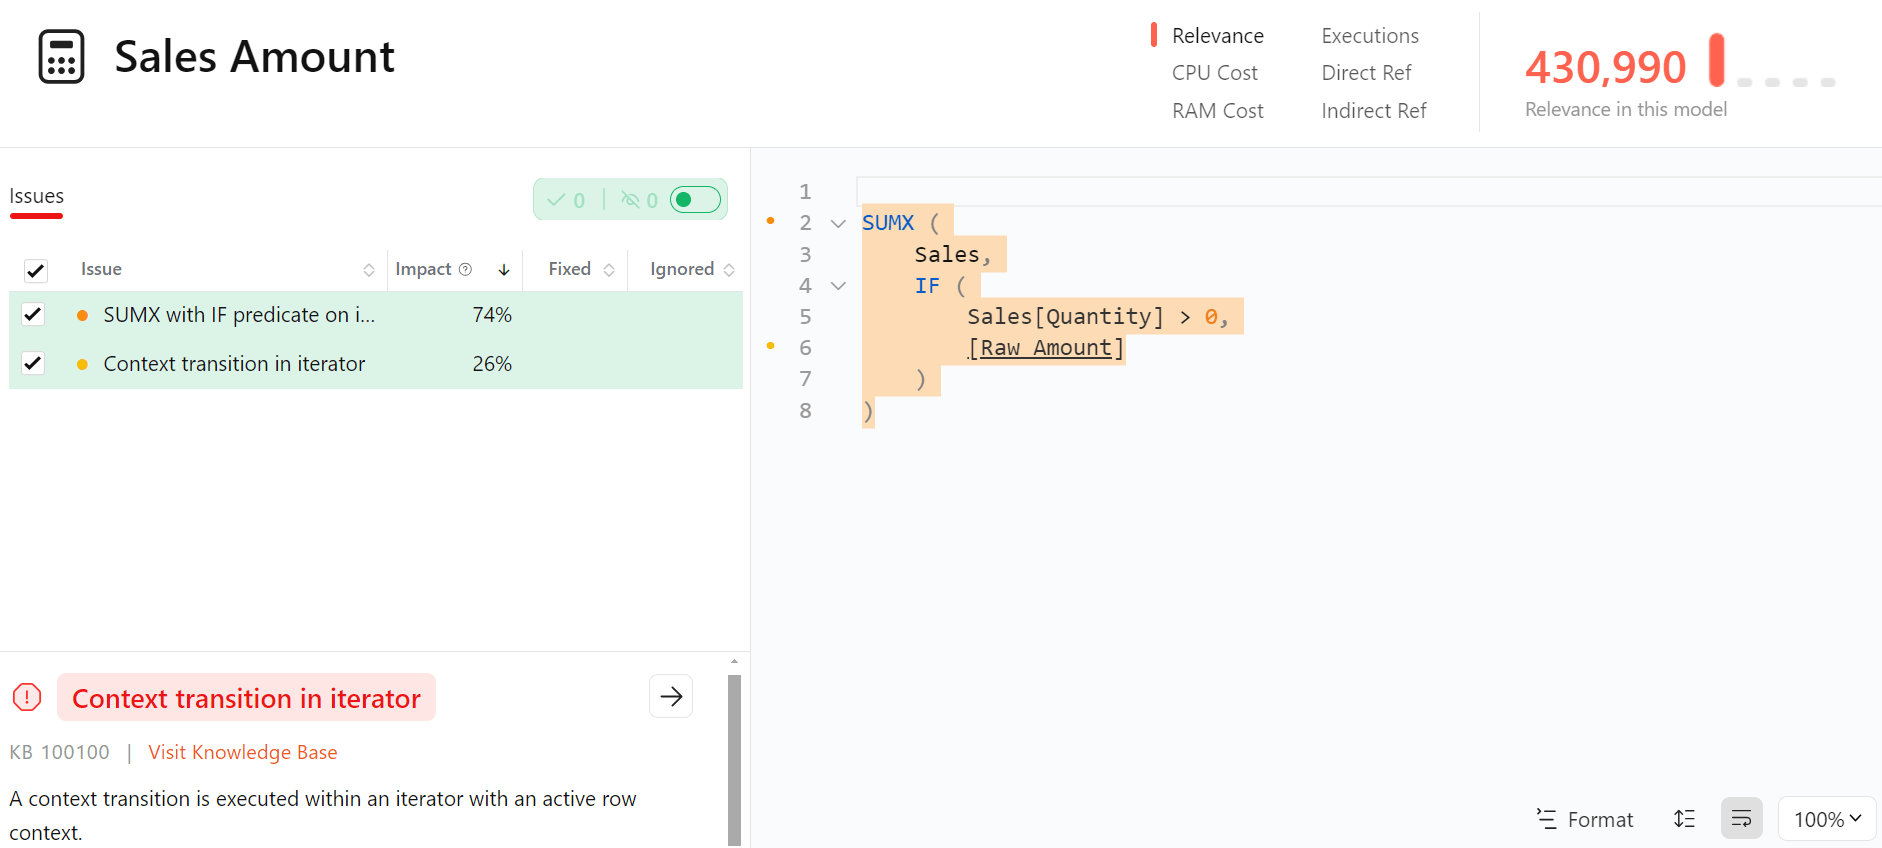
By clicking on the measure name, DAX Optimizer shows the issue details.
The list of issues provides details about the relative impact on the performance of the measure.
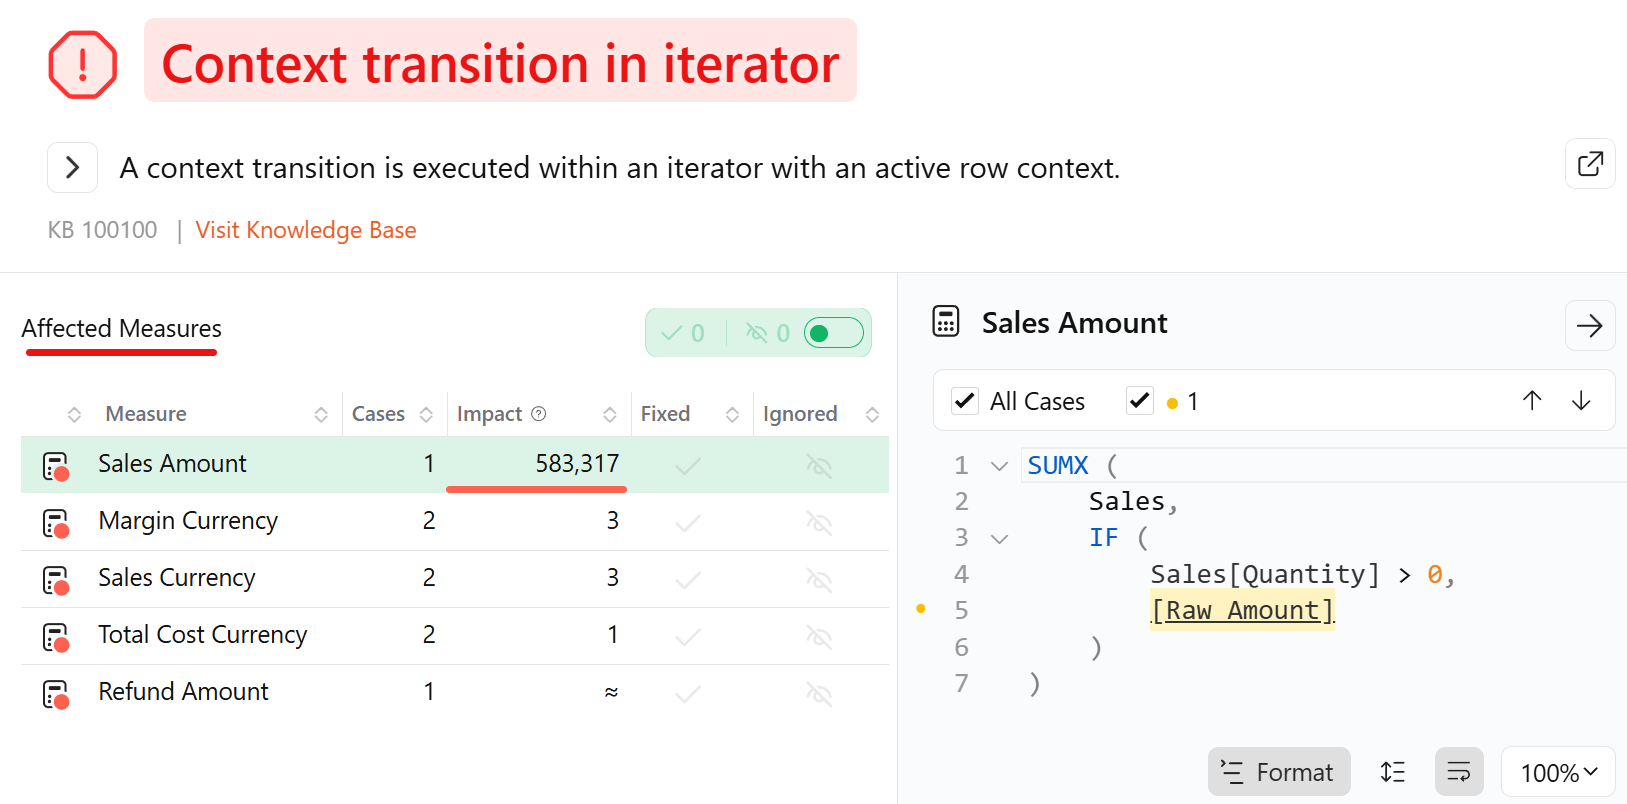
To know more about the issue, visit the knowledge base or click on the Right Arrow in the Content transition in iterator section to expand the issue description.
By expanding the issue description, DAX Optimizer shows a more detailed explanation and examples of the code that you can use to fix similar issues.
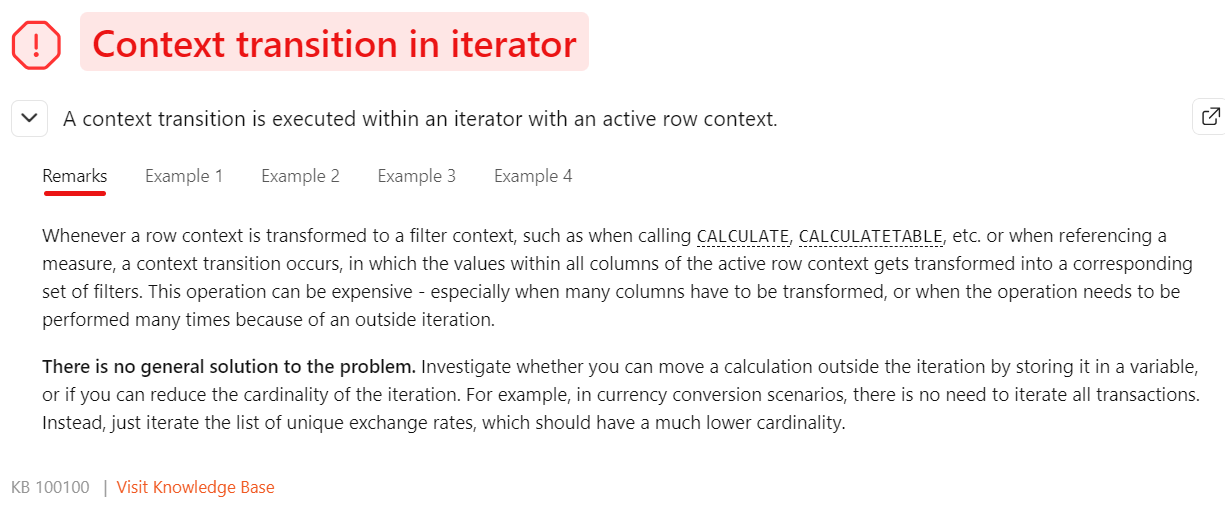
In this case, the issue is related to the callbacks in a SUMX iterator, which is a common anti-pattern in DAX.
Among the proposed examples to optimize your code, choose the one that better represents the structure of your code.
NOTE: The proposed code examples are general code examples. To fix the particular issue you are facing, you need to readapt the proposed code to your particular case. Among the proposed ones, we suggest choose the one that better represents the structure of the DAX code you have written.
Go to your model editor, change the DAX code accordingly to the proposed example by DAX Optimizer that best represents your situation, and load another version of the model in DAX Optimizer by clicking on + Version.
NOTE: If you are following this sample walkthrough guide by reading this guide and confronting it to the pre-loaded models without adding the fixed model, at this point you have to switch to the
V2of the Contoso 1M - currency conversion model.
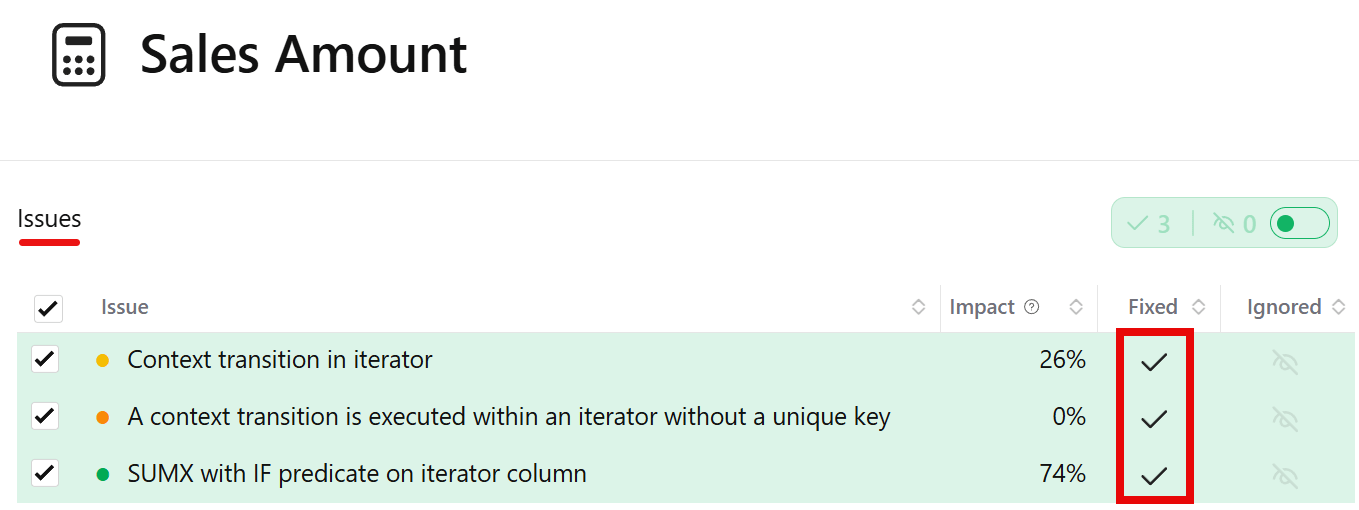
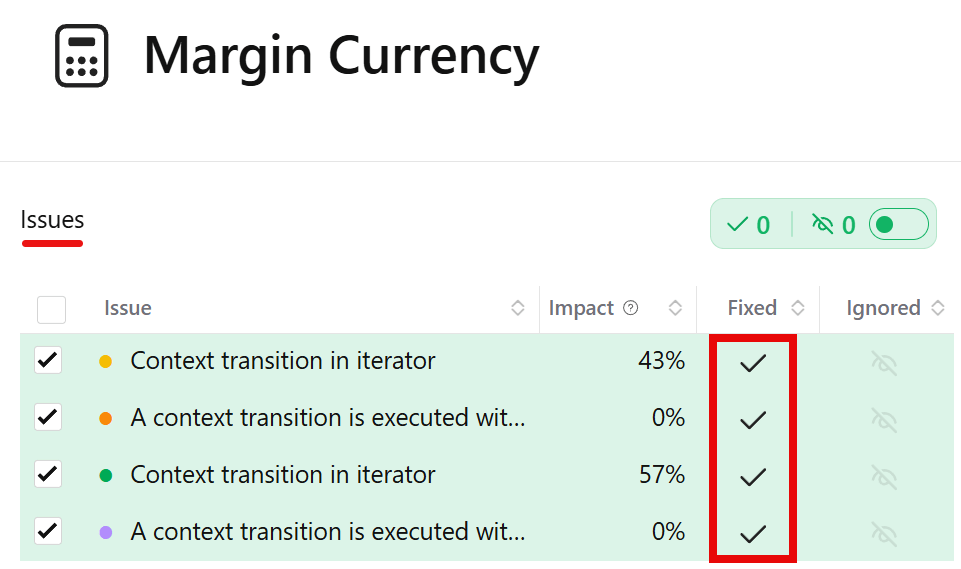
Then, mark as fixed the issue in DAX Optimizer. In this specific case, because the code change also removed the iterator, you have to mark as fixed even the other two issues.
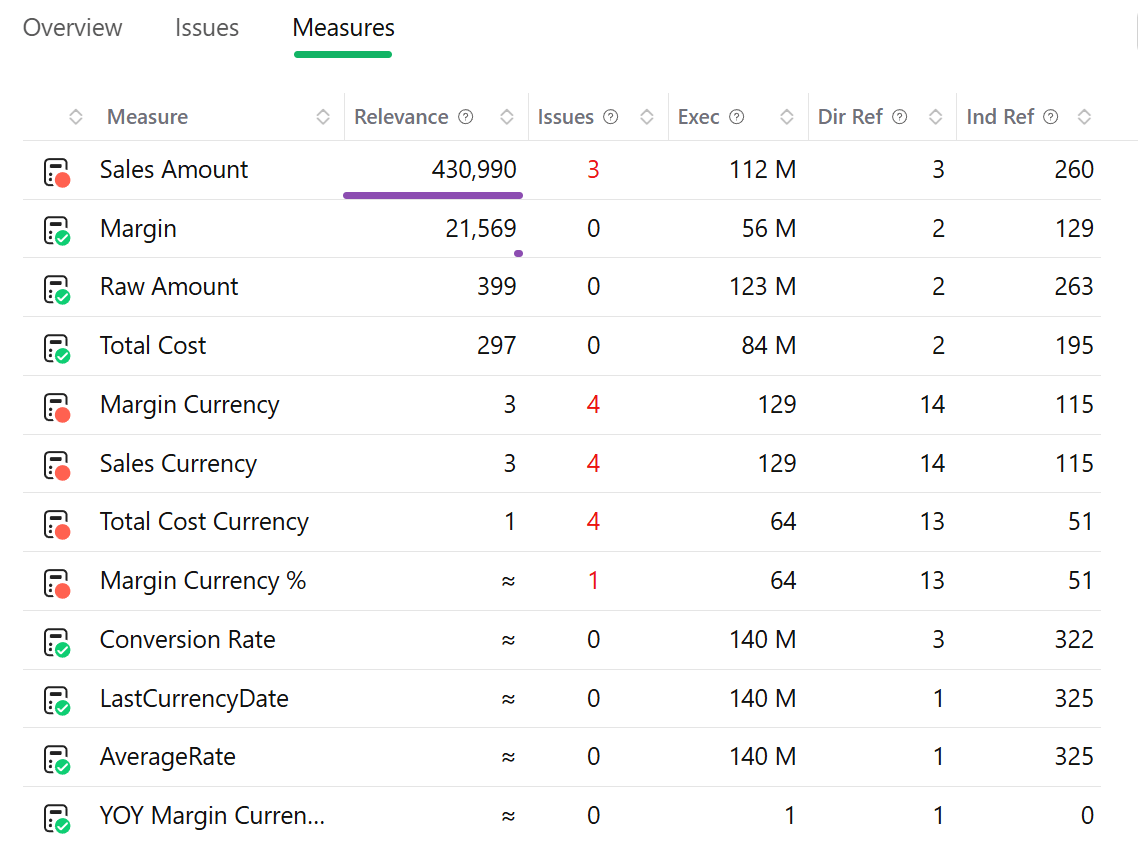
Now, go to the Measures page, and filter for the measures that have issues by clicking on View / Issues only.
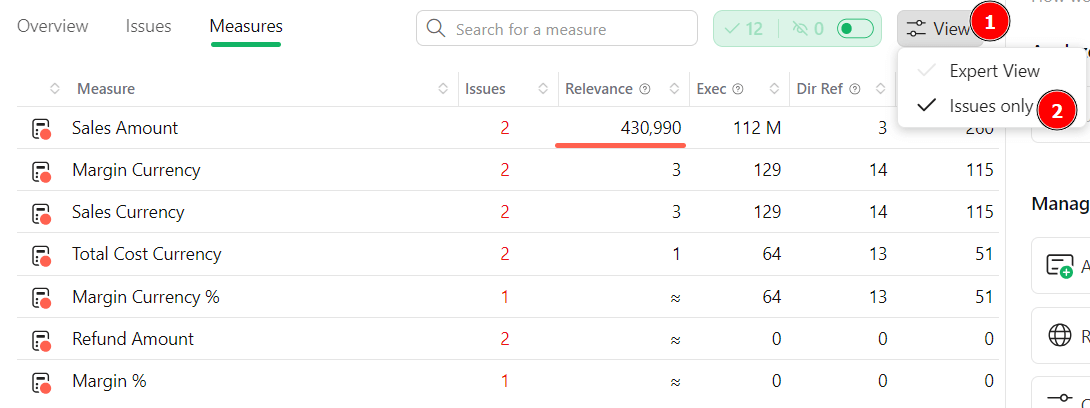
The measures without issues are now hidden. You can also hide the measures that have no issues open by clicking Toggle Fixed/Ignored Issues. The remaining measures with open issues have a smaller relevance. However, this does not mean that they are not important. They simply have a lower priority compared to other measures, but once the measures with higher priority are fixed, the focus can be on the other remaining measures.
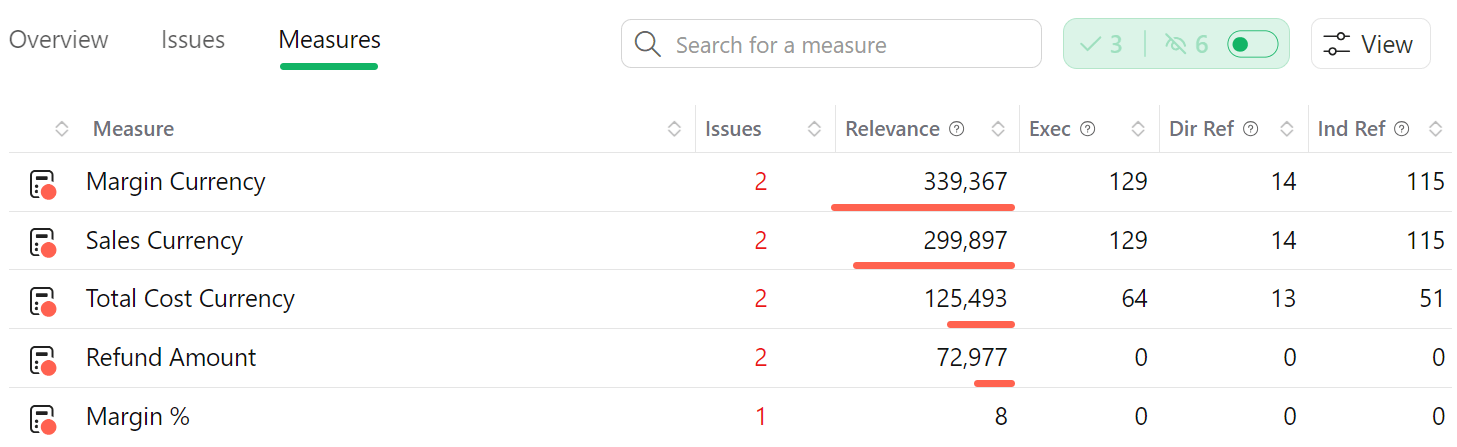
Now, in this case, there are five measures with high relevance. In reality, the relevance did not change: it is only normalized to a different scale to make the numbers easier to compare.
You can now focus on the Margin Currency measure, which has four issues, two for each issue type detected.
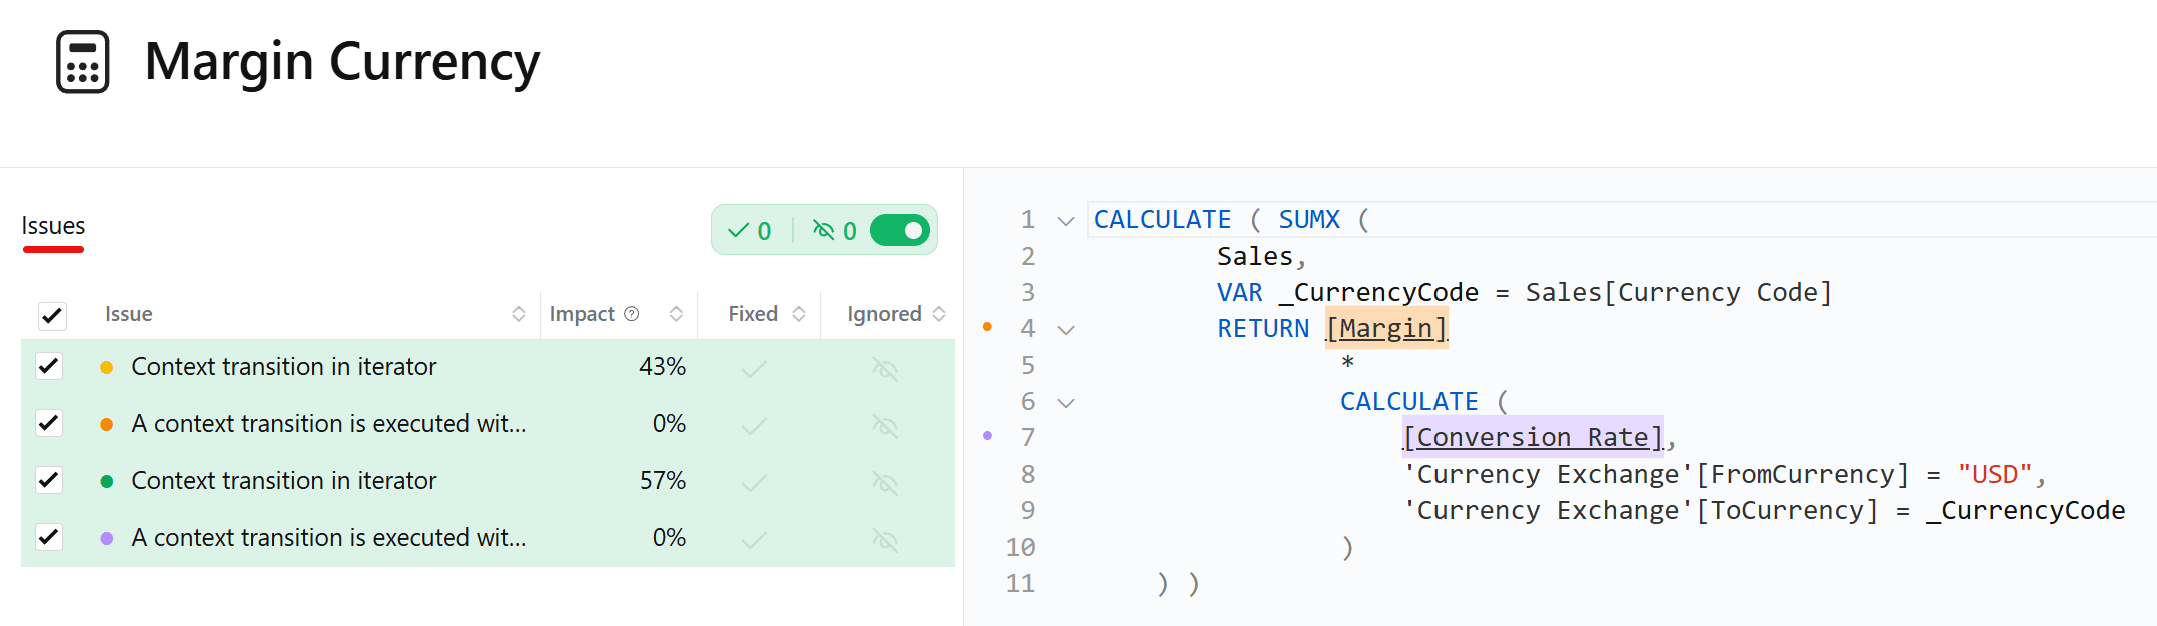
In this case, you should reduce the cardinality of the iterator, because you cannot assume that the result will be the same by moving a measure outside of the iterator. In this case, the result of Conversion Rate seems to depend on the Sales[Currency Code] column because of the CALCULATE function. However, you should verify whether there are other dependencies.
By clicking on Conversion Rate, you can see the corresponding DAX definition.
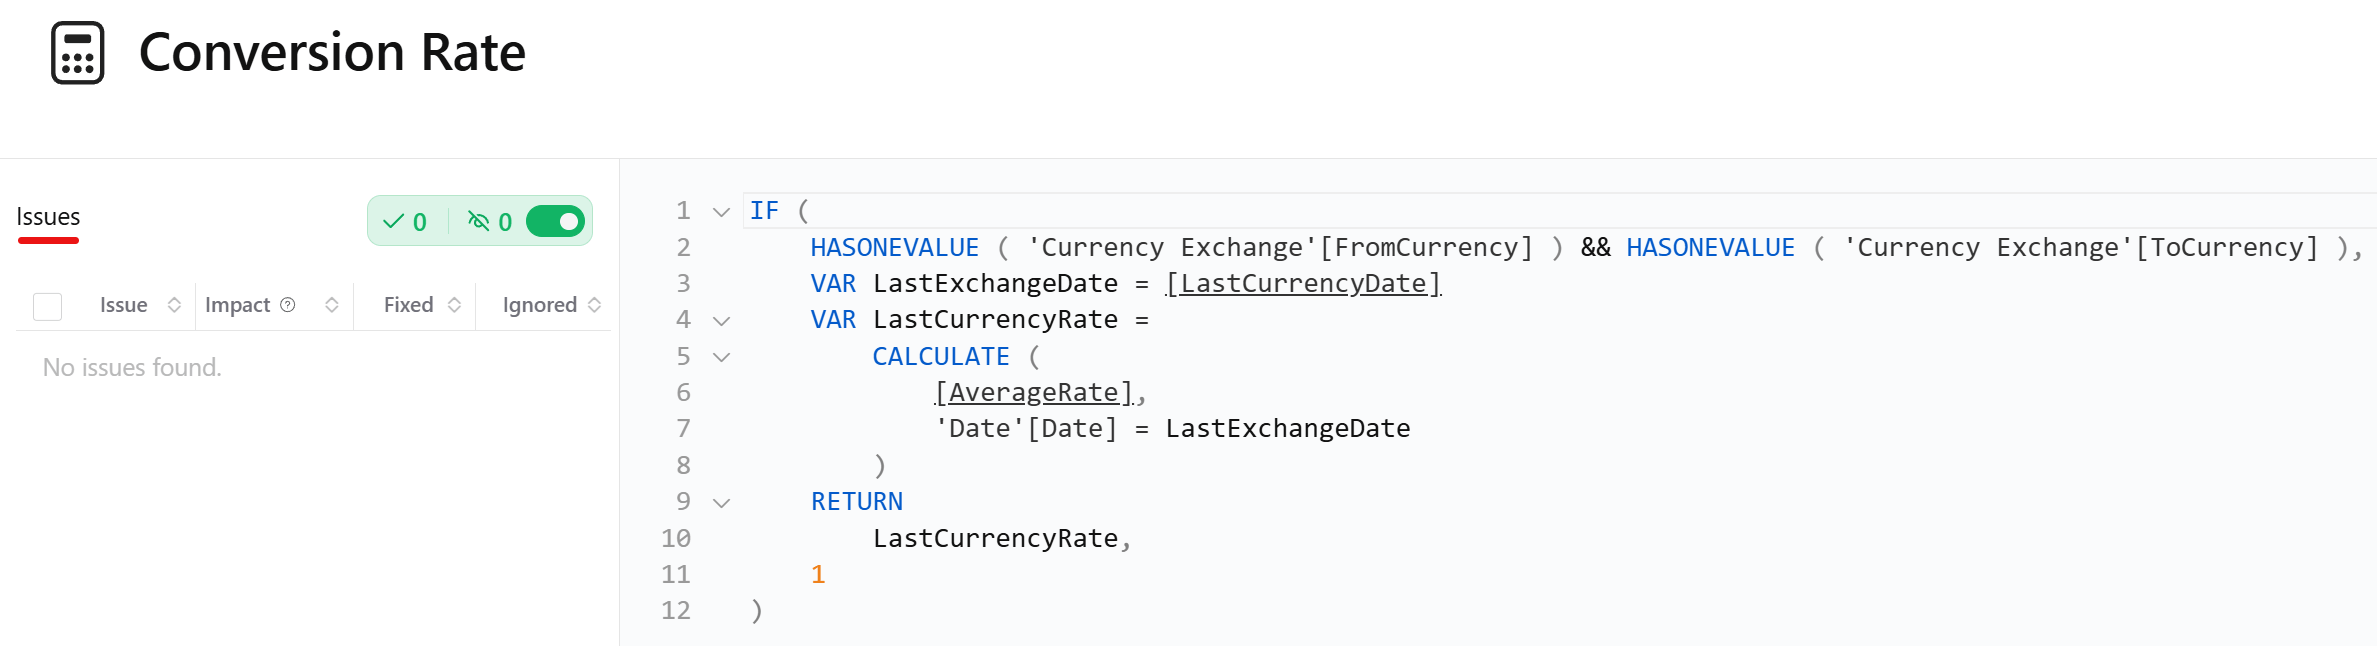
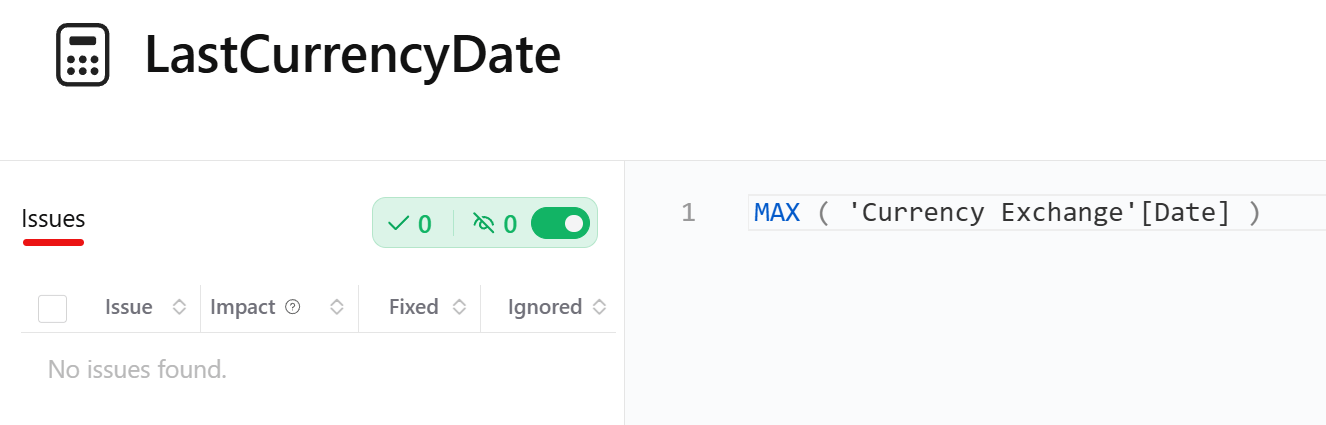
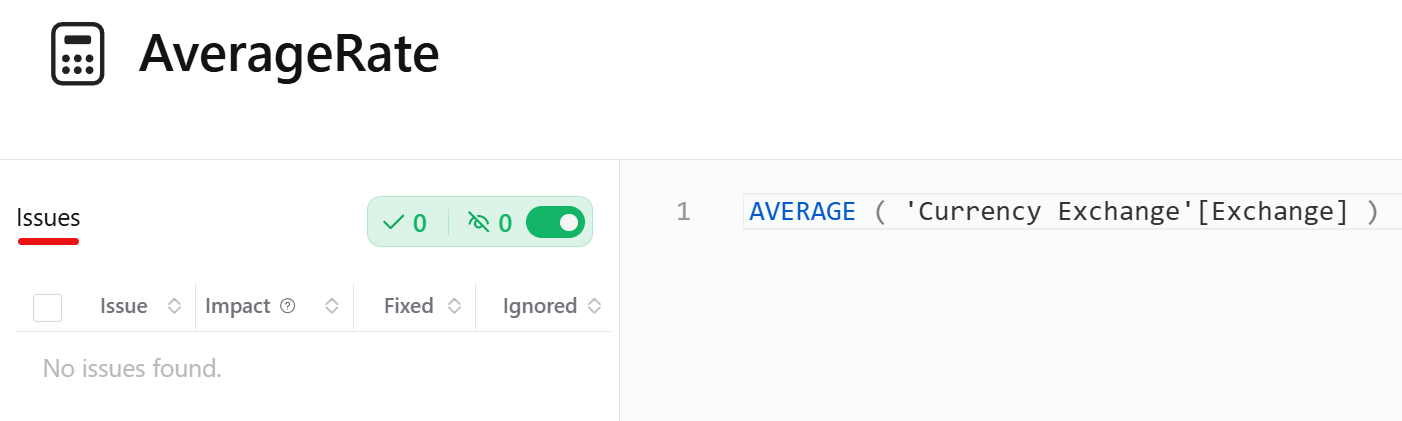
Repeat this process with LastCurrencyDate and AverageRate , to make sure you are aware of the dependencies involved.
From the code analysis, we can establish that Conversion Rate depends on the Date and Currency Exchange tables. The Date table is not directly referenced in the Margin Currency code. However, you should check also the relationships in the semantic model, because, by iterating Sales, the context transition is applied to the expanded table, which expands the table by including all the columns on the one side of any relationship.
The relationship diagram is necessary to evaluate this aspect.
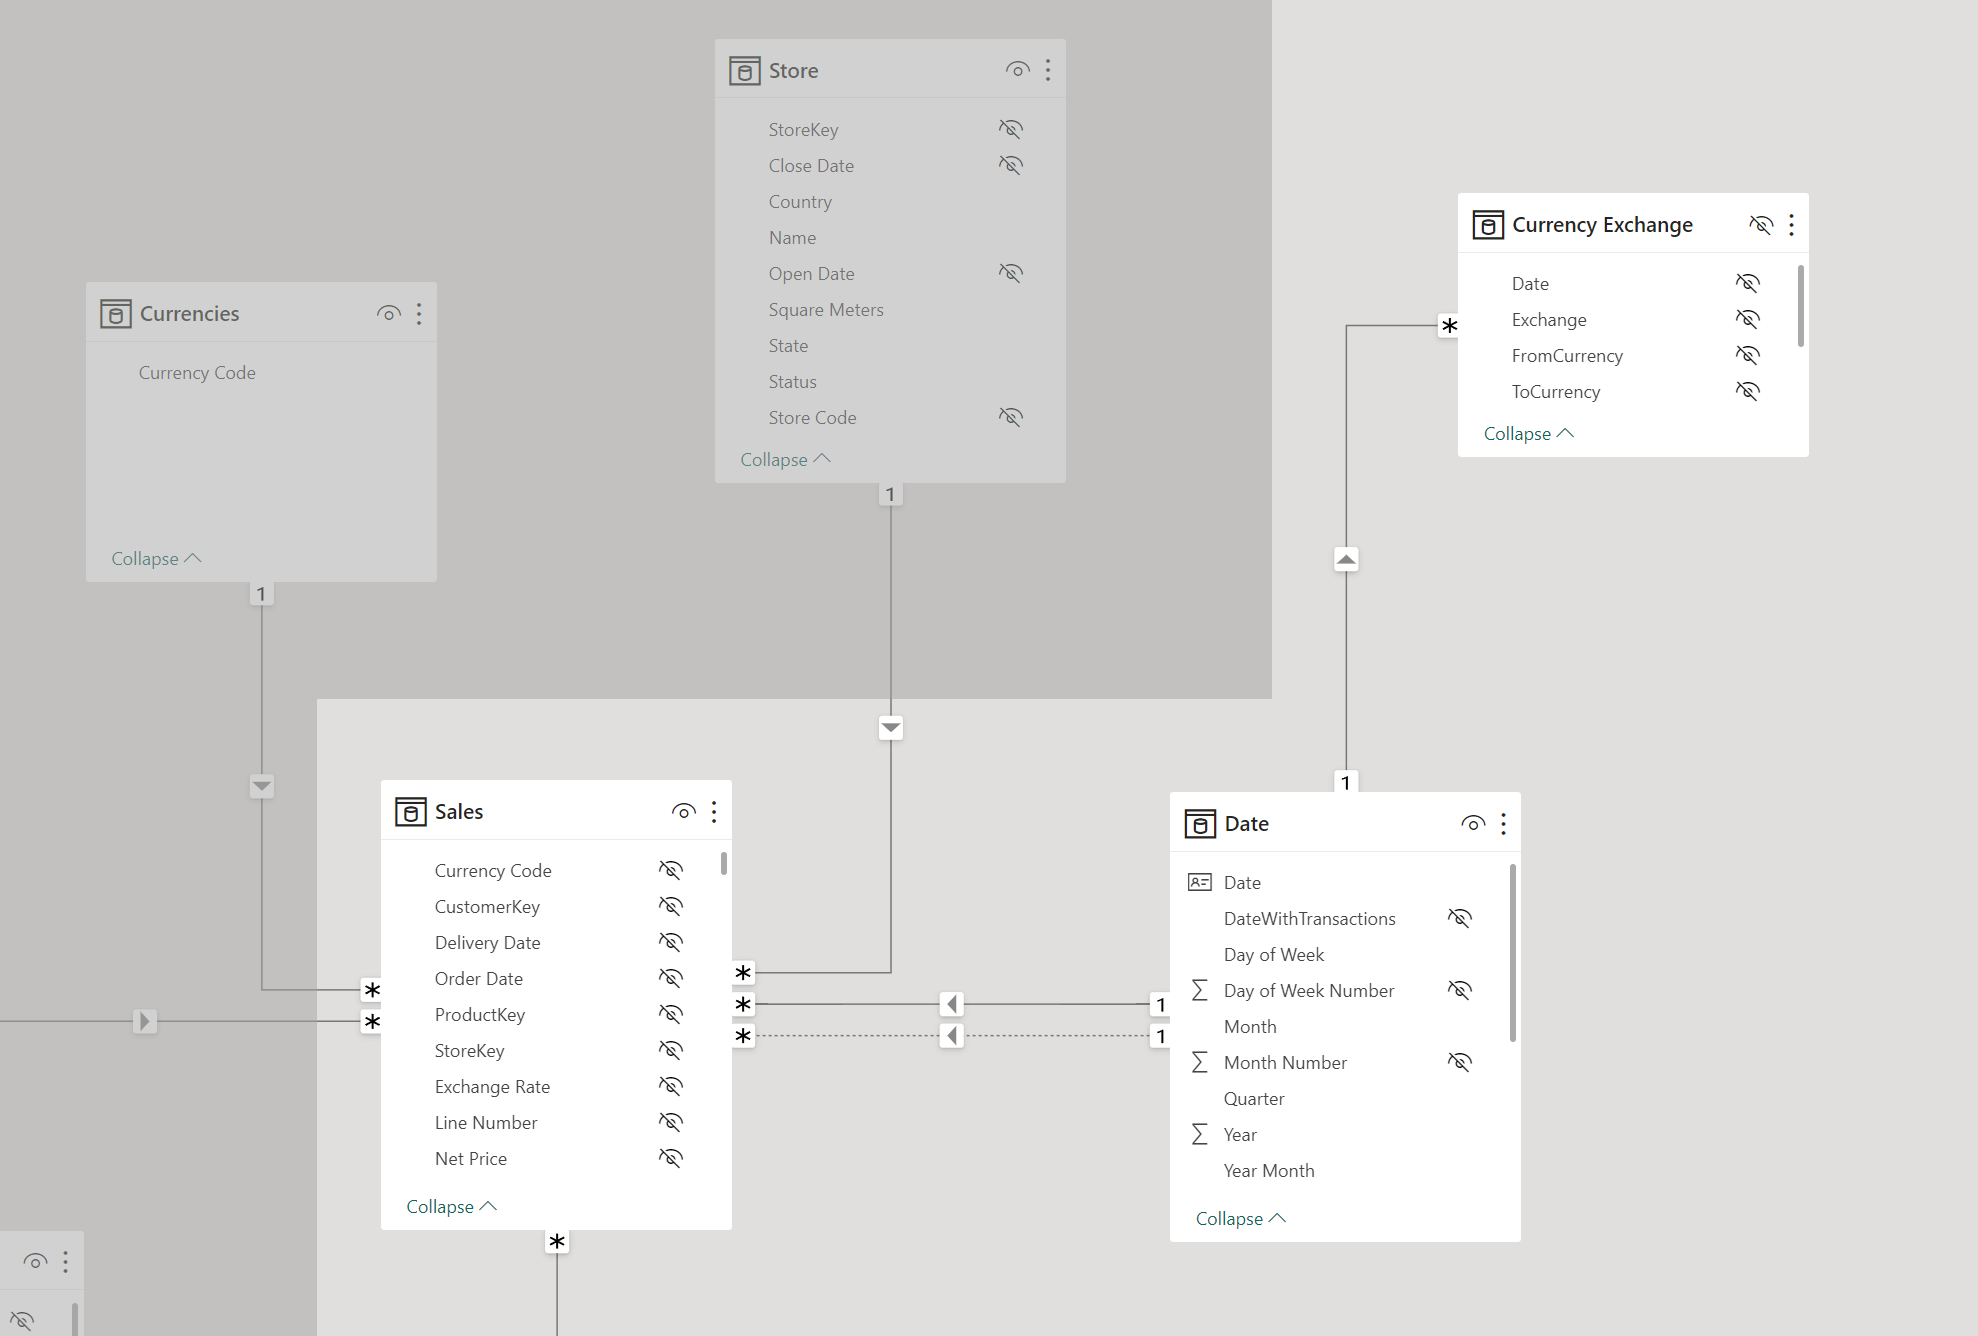
The Sales table has a relationship with the Date table, which means that when you iterate Sales, for every context transition on Sales you also filter one row in Date. Therefore, we can reach to the conclusion that the Conversion Rate measure depends on Dat[Date] and Sales[Currency Code]. If you authored the measures, you might already know that, but it is always a good idea to check these dependencies before trying to write a more efficient version of the same code.
The following is the actual DAX code, with the Sales tables highlighted in the SUMX iterator.
CALCULATE (
    SUMX (
        Sales,
        VAR _CurrencyCode = Sales[Currency Code]
        RETURN
            [Margin]
                * CALCULATE (
                    [Conversion Rate],
                    'Currency Exchange'[FromCurrency] = "USD",
                    'Currency Exchange'[ToCurrency] = _CurrencyCode
            )
    )
)
The solution you can choose can be similar to the Example 3 of the Context transition in iterator issue.
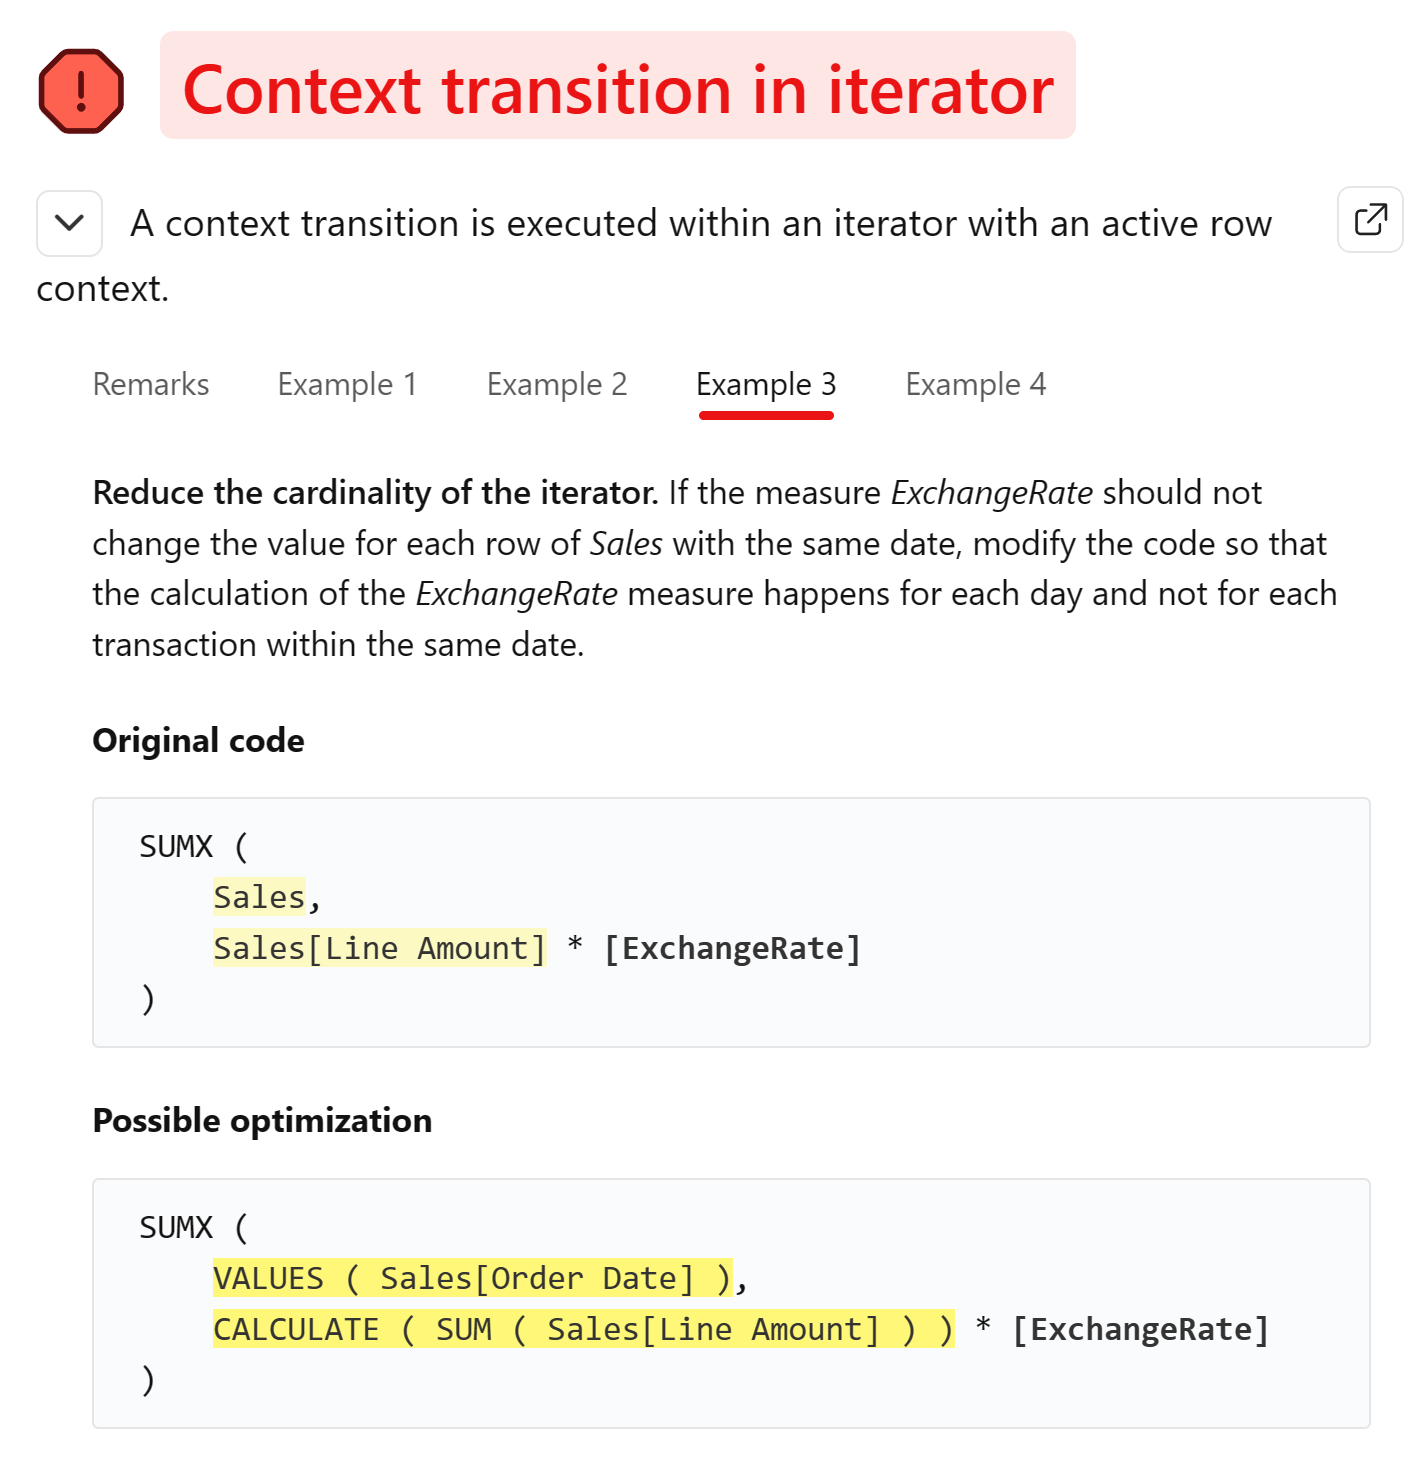
You can generate a table with the unique values of the columns included in the dependencies for the measures inside the iterator. This change should be enough to reduce the complexity of the calculation and improve the performance.
CALCULATE (
    SUMX (
        SUMMARIZE ( Sales, 'Date'[Date], Sales[Currency Code] ),
        VAR _CurrencyCode = Sales[Currency Code]
        RETURN
            [Margin]
                * CALCULATE (
                    [Conversion Rate],
                    'Currency Exchange'[FromCurrency] = "USD",
                    'Currency Exchange'[ToCurrency] = _CurrencyCode
            )
    )
)
You can now mark Margin Currency as fixed for all the issues.
Repeat a similar optimization for Sales Currency and Total Cost Currency.
The measure Margin Currency % has a different issue, instead.
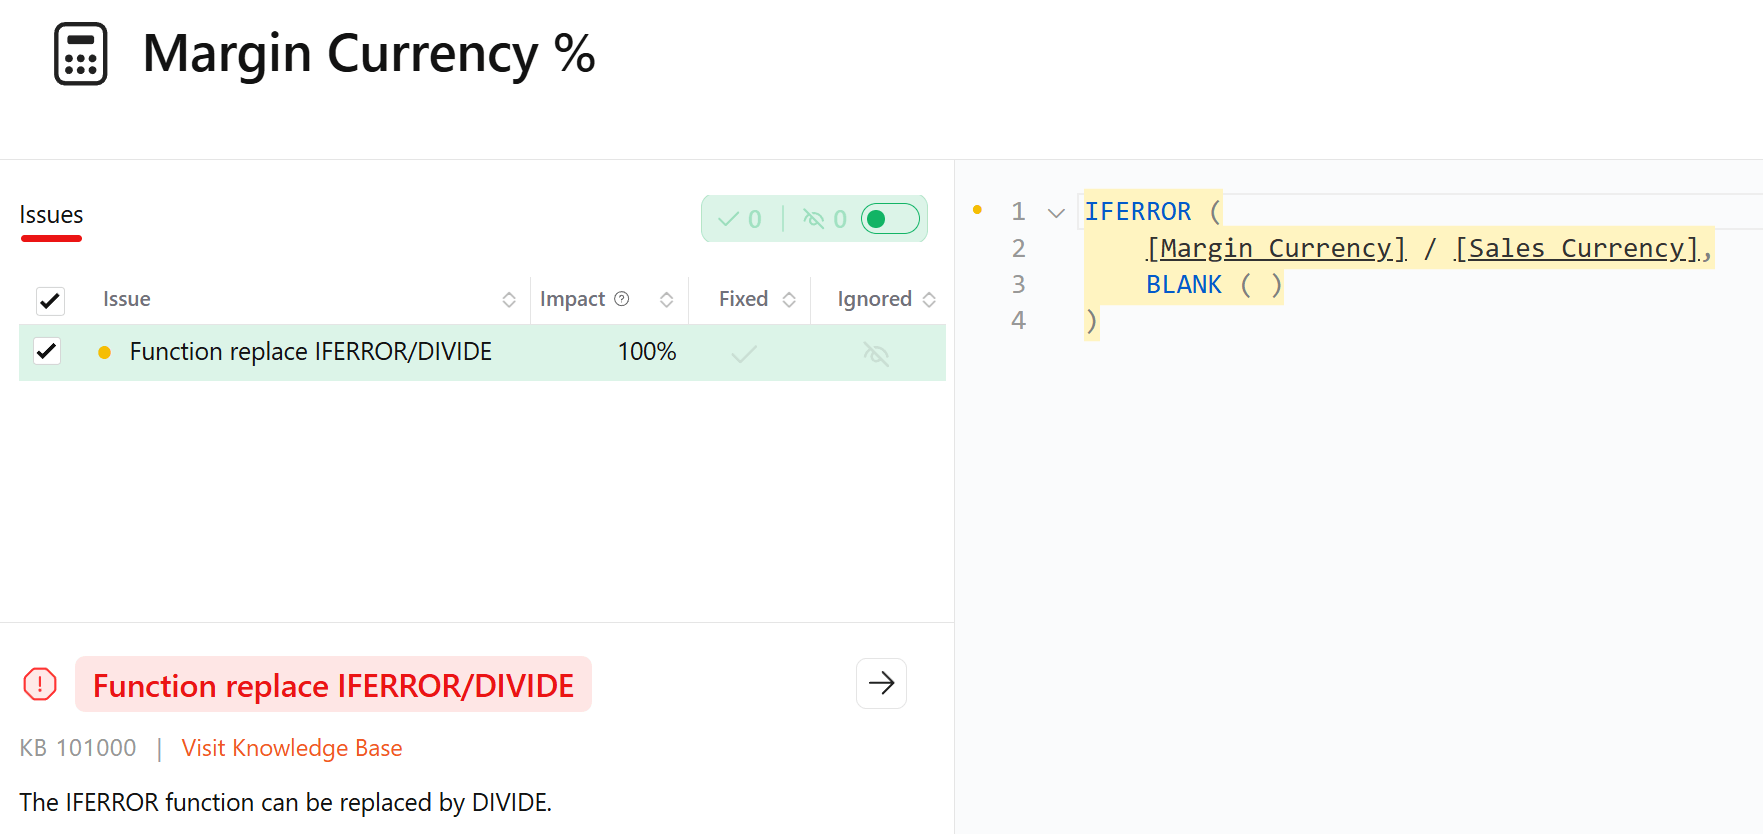
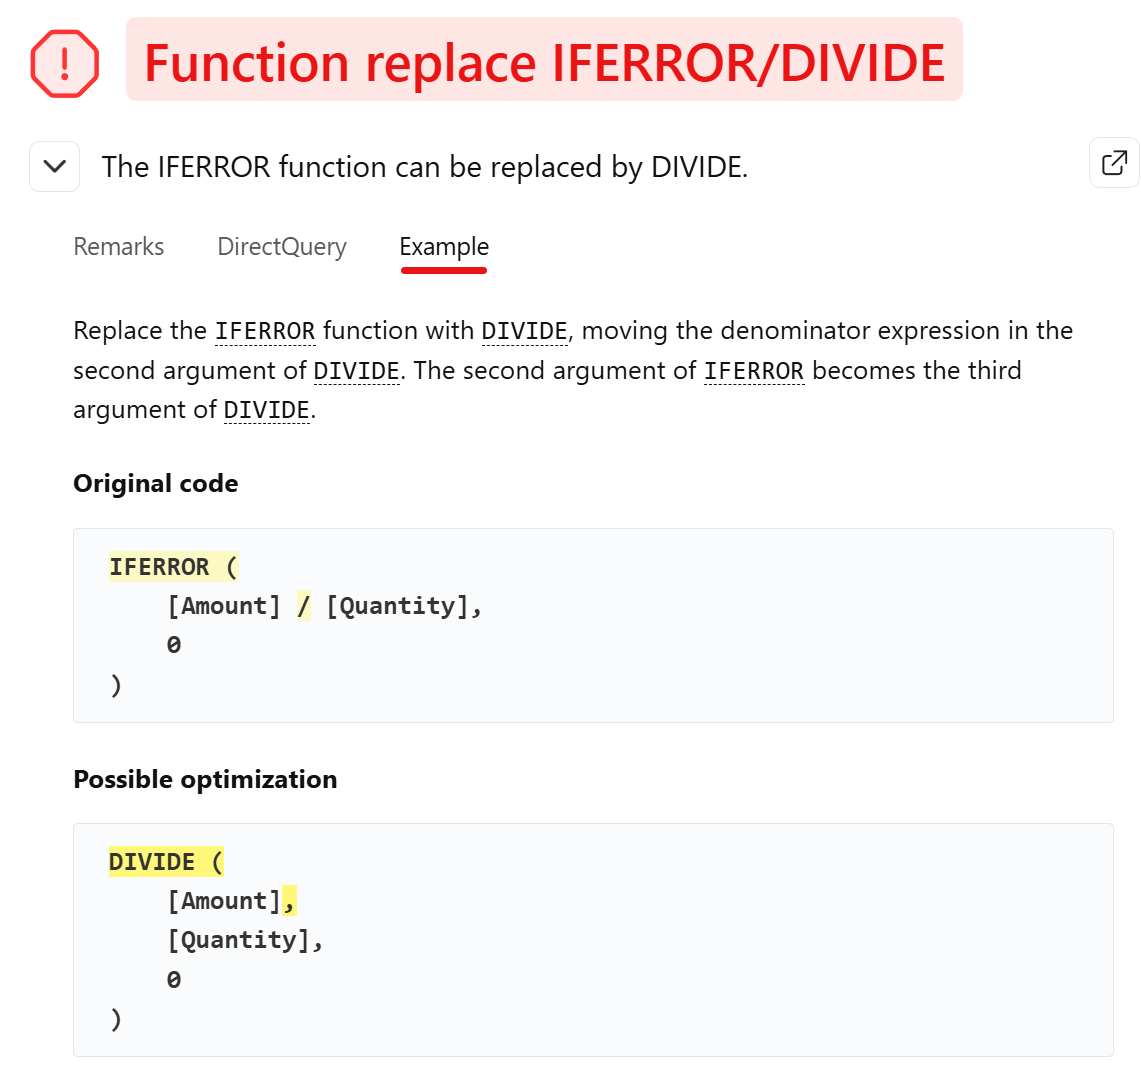
The provided example shows how to transform a division within IFERROR in a DIVIDE function.
Here is the code of the initial Margin Currency % measure:
IFERROR ( [Margin Currency] / [Sales Currency], BLANK() )
Modify the definition as follows:
DIVIDE ( [Margin Currency], [Sales Currency], BLANK() )
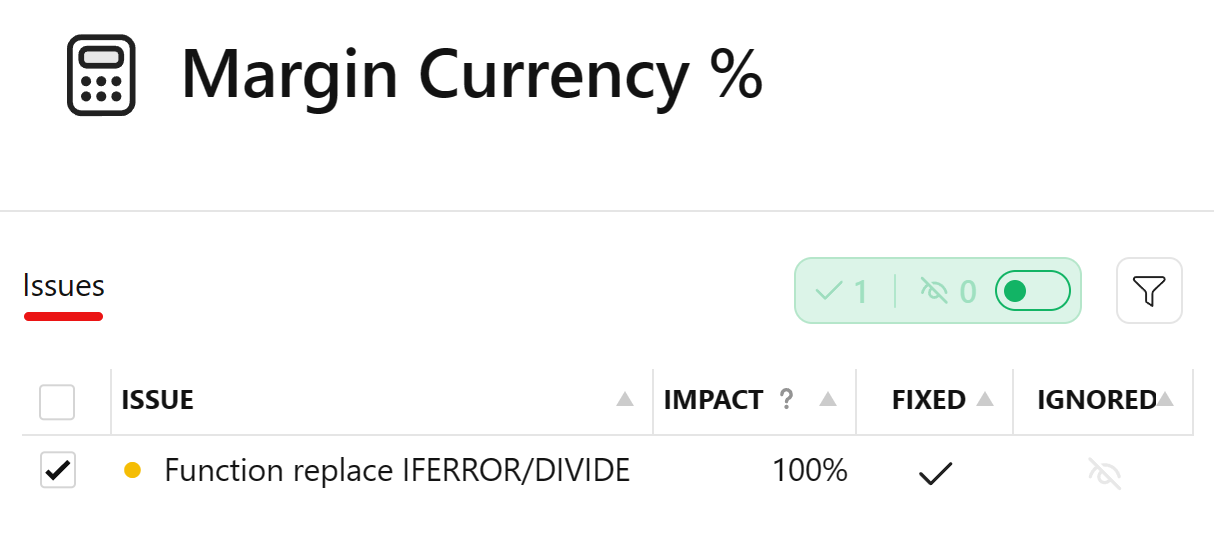
You can now mark the issue on Margin Currency % as fixed.
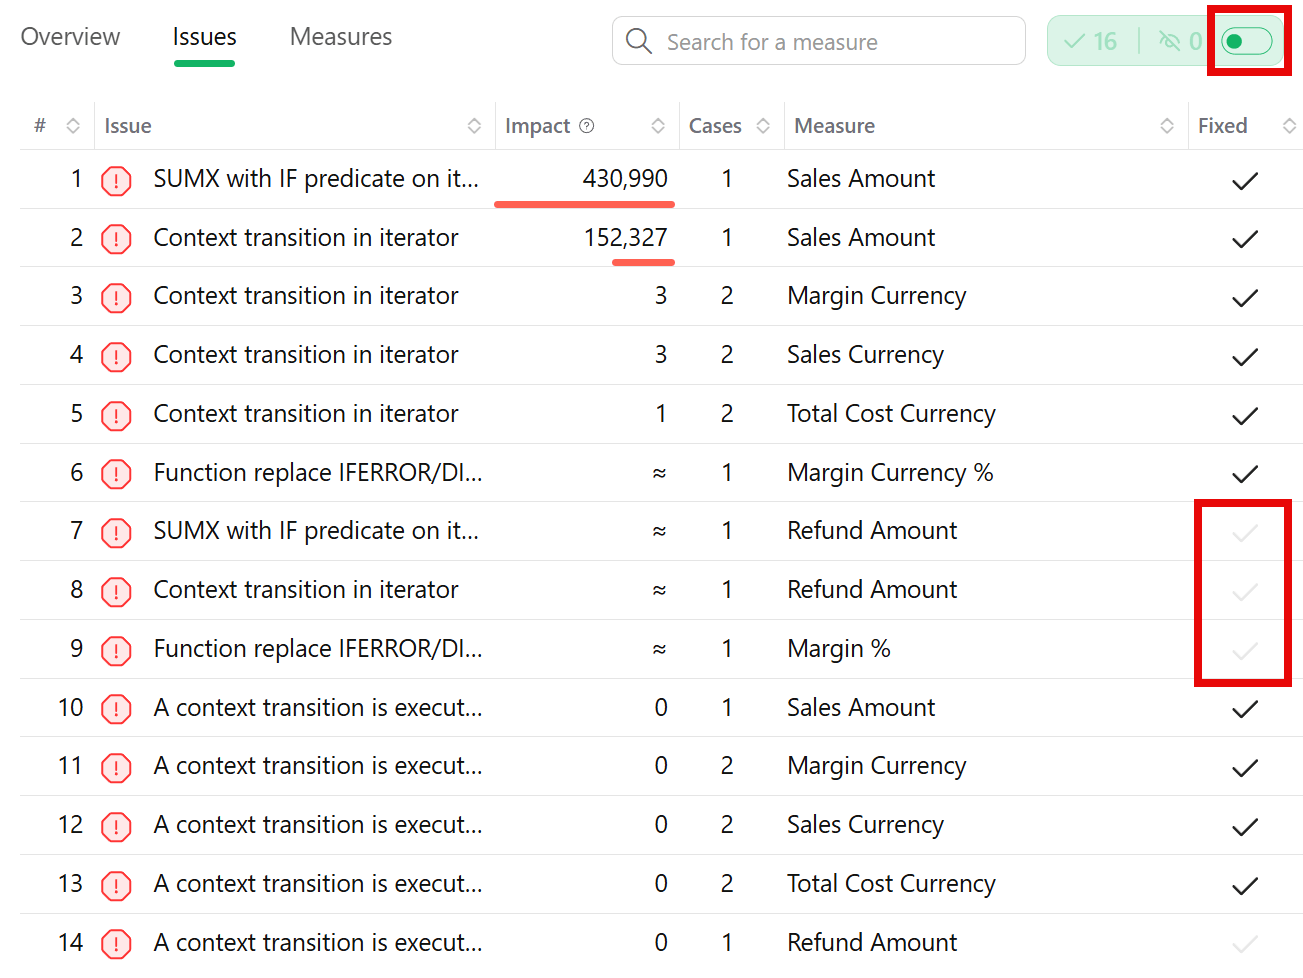
Returning to the Issues page, there are now four issues on two measures that have not been fixed yet.
However, the impact of the remaining issues seems very small compared to the issues that we already fixed.
You can continue fixing measures until there are no more issues in the model, but the optimizations already made should have a significant impact on the performance of the model.
In fact, you might have already achieved an optimization goal that is good enough for your requirements: you decide when to stop the optimization process.
Now you can validate how the fixed measures have improved the performance of the model by loading your optimized model as a new version.
Note that the Unverified badge highlights when all the model issues have been declared as fixed, but they have not been verified yet by DAX Optimizer.
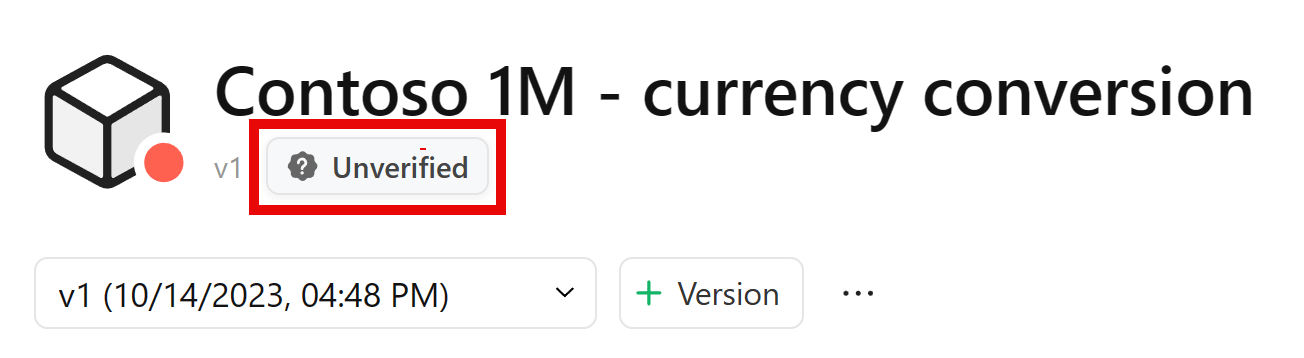
The final state of the fixed measures is version 2 (v2) of the model Contoso 1M - currency conversion optimized.
You can now continue the analysis by verifying the fixed issues.