This section describes how to manage the settings in DAX Optimizer.
Note that the management of some of the settings has been described in other sections of the documentation. These are referred to with links to the other sections of the documentation.
The general page
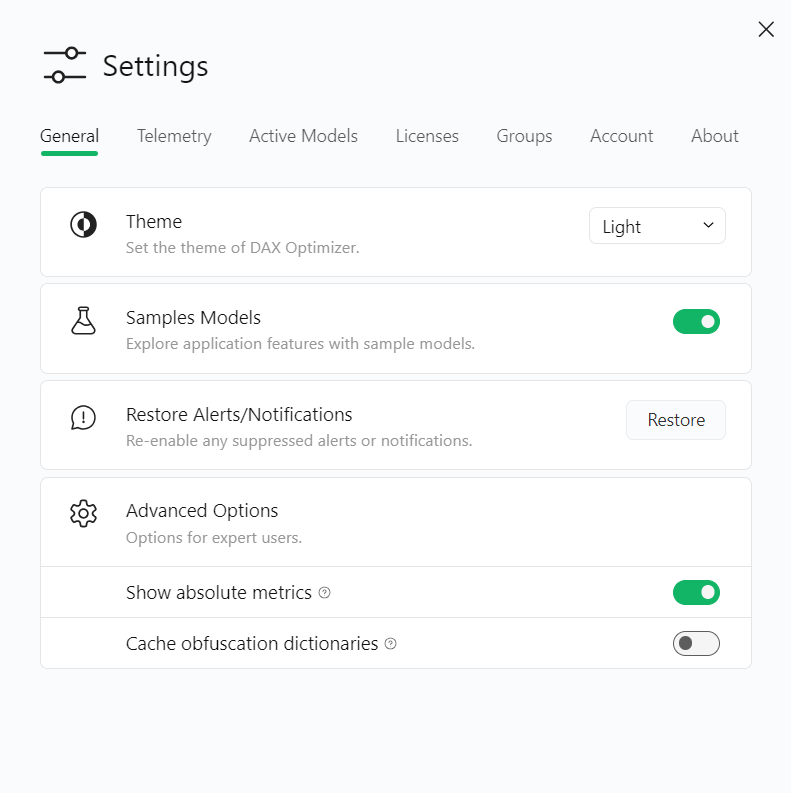
The General page in the Settings presents the following features:

- Theme. Use this option to change the theme of Dax Optimizer. A dark theme may be your preferred choice.
- Samples Models. This option enables the sample models to perform the sample walkthrough.
- Restore Alerts/Notifications. By clicking on Restore, you will restore notifications you have eventually canceled. The notifications can be managed in the home of DAX Optimizer, by clicking on the bell icon.
The Advanced Options section needs a detailed explanation.
Advanced options: Show absolute metrics
This option affects the columns Relevance, CPU cost, and RAM Cost as follows:
- If enabled, the values are normalized to the maximum value in the current model, considering also fixed and ignored issues.
- If disabled, the values are normalized to the maximum value in the current model, without considering also fixed and ignored issues.
As a practical example, consider the V1 of the Contoso 1M model described in the Sample Walkthrough section.
Leave the Show absolute metrics toggle disabled in Settings.
In the Issues page, click on View > Expert View.
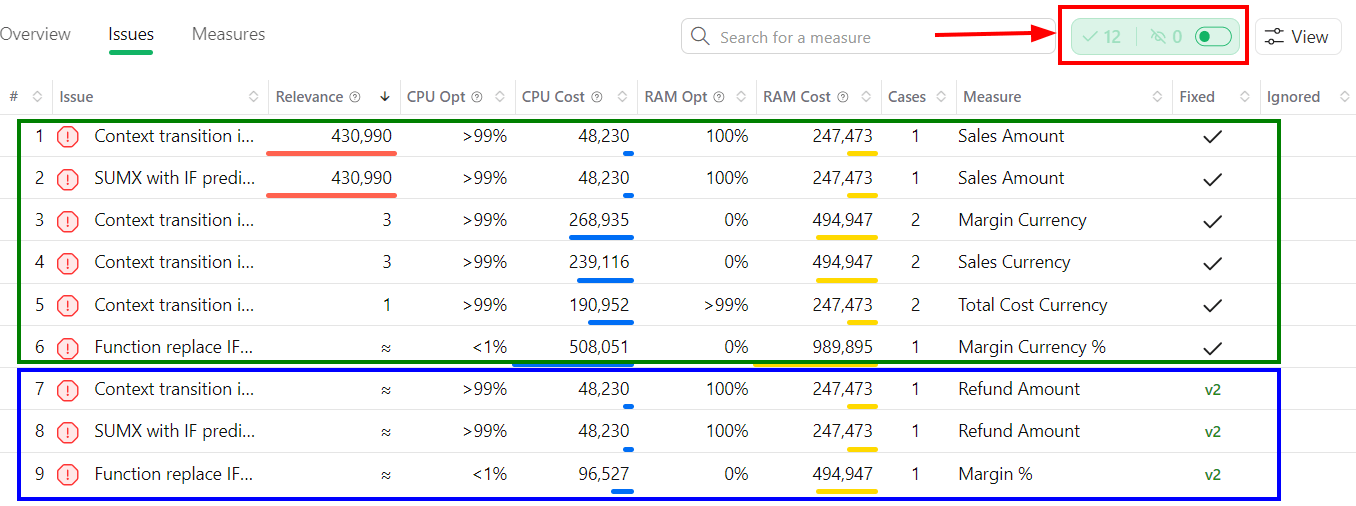
Here is how the metrics appear without filtering for fixed and ignored issues:

Here is how the same metrics appear when filtering for fixed and ignored issues:

Now, enable the Show absolute metrics toggle in Settings and refresh the page.
Here is how the metrics appear without filtering for fixed and ignored issues:

Here is how the metrics appear without filtering for fixed and ignored issues:

Summarizing:
- If you want to know how fixed and ignored issues affect Relevance, CPU cost, and RAM Cost, disable the Show absolute metrics toggle.
- If you do not want to know how fixed and ignored issues affect Relevance, CPU cost, and RAM Cost, enable the Show absolute metrics toggle.
NOTE: When switching the toggle to enable or disable the Show absolute metric option, refresh the page to make the changes effective.
Advanced options: Cache obfuscation dictionaries
As DAX Optimizer uses Microsoft Azure services, you may be interested in obfuscating your VPAX models for security reasons.
When the toggle is enabled, you can save the deobfuscation dictionary in your browser’s cache so that you do not need to load it every time you open DAX Optimizer.
Learn more about obfuscation here and how to obfuscate and deobfuscate VPAX files here.
The telemetry page
Enabling the telemetry toggle allows the staff of DAX Optimizer to collect anonymous information on how you use DAX Optimizer. This comes in help in case you receive errors from the software.
If the telemetry toggle is disabled, our intervention capacity for eventual errors you may face may be limited. In that case, we may ask you for more details about issues you may face.
The active models page
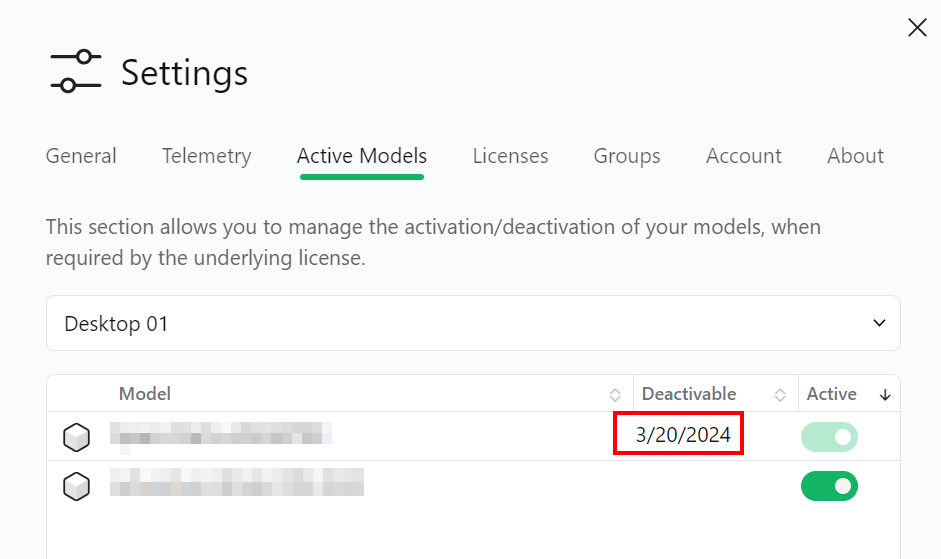
This page lists all the VPAX models, allowing you to activate or deactivate a model at your will, but this can be done under the condition of a date.

This condition is because licenses can be assigned to different models. Since each license can manage a limited number of models, this condition prevents users to use use a license on an unlimited number of models. This is why you can deactivate a license on a model and activate it on another after one month.
The licenses page
This section allows you to manage your licenses.
Learn how to manage them in the dedicated section.
The groups page
This section allows you to manage groups of users.
Learn how to manage them in the dedicated section.
The account page
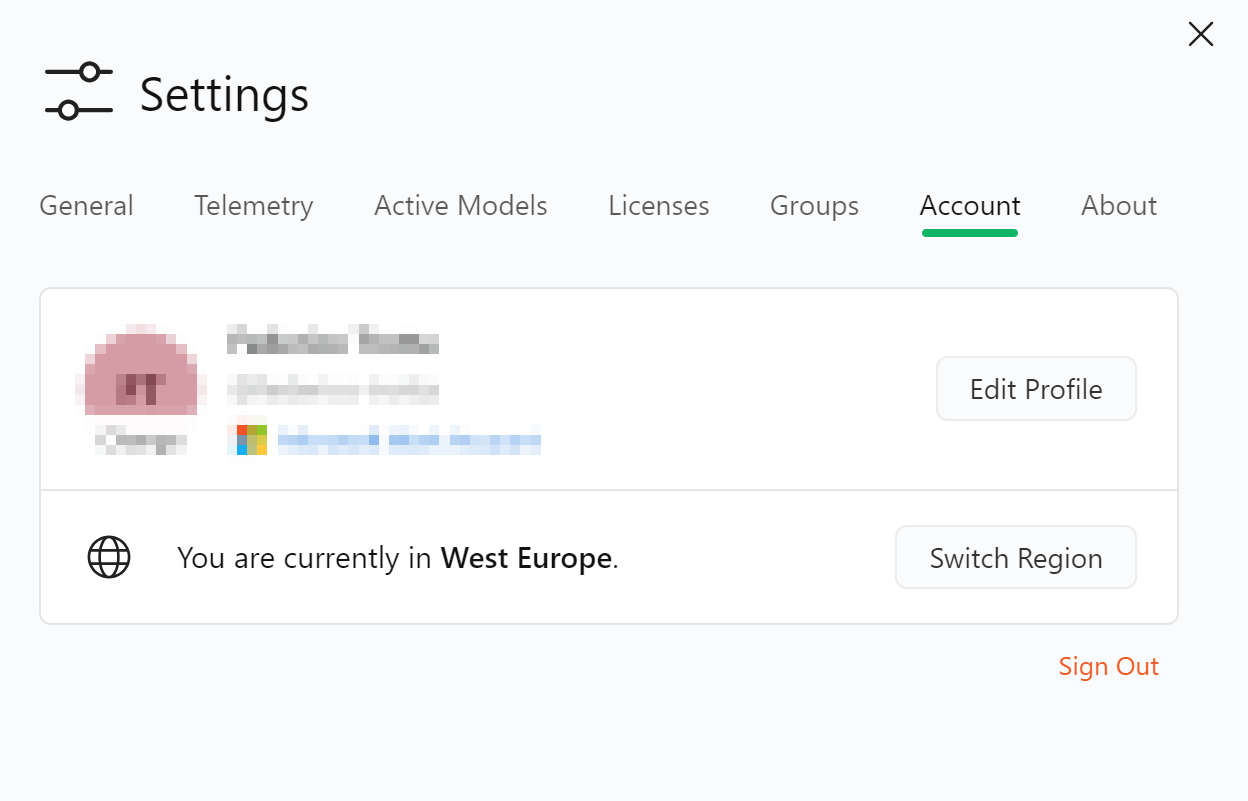
This section allows you to edit your profile and to switch regions.

Learn how to switch regions in the dedicated section.
The about page
This section shows the current version of DAX Optimizer and allows you to report issues.
NOTE: The issue reporting feature is currently in BETA.

