The analysis of a model generates several metrics used to prioritize the issues reported by DAX Optimizer.
This section describes each metric, but consider that DAX Optimizer performs a static analysis of the DAX expressions, generating an estimation of the cost that cannot match the actual cost of each element.
Therefore, the comparison between metrics makes sense only in relative terms. So, do not make any assumptions about the absolute values reported in each metric.
Furthermore, to display the metrics more intuitively, DAX Optimizer automatically rescales the numbers with a meaningful number of digits.
Overview metrics
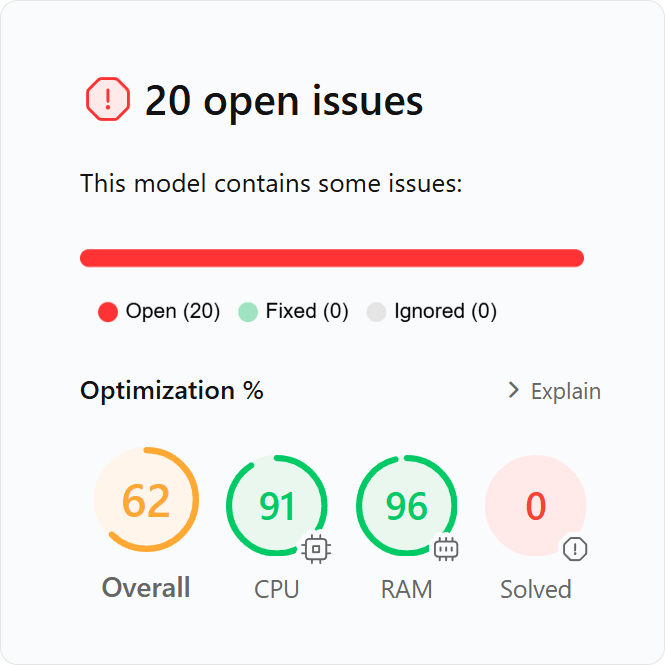
After the analysis of a VPAX file, DAX Optimizer displays an Overview page reporting four.

The open issues found by DAX Optimizer affect the VPAX models as follows.
Overall
It’s the mean value of the other three metrics and represents a global recap of how the model is performing. If the model is performing well globally, this metric will be near 100.
CPU
It indicates how hard are the open issues stressing the CPU. Models without CPU issues have a value near 100.
RAM
It indicates how hard are the open issues stressing the RAM. Models without RAM issues have a value near 100.
NOTE: This metric has even an indirect importance, as a high RAM consumption of your models determines the execution capacity of your Power BI subscription: the more RAM you consume, the more you need a greater capacity of the underlying system and, therefore, spend more. Therefore, DAX Optimizer helps you spend less through this metric.
Solved
This metric indicates the percentage of the issues found in the model that have been solved. Models without open issues have a value near 100.
Issues metrics
The Issues page regroups the issues of a VPAX model by issue type and measures referring to the following metrics.
Impact
Potential optimization of CPU and RAM compared to other issues. Use this value only to prioritize the issue over other issues. The impact value is normalized using a normalization factor and the tooltip on the number shows the actual value computed in the analysis.
Cases
It shows the number of issues of the same type detected in the measure.
Measure
It shows the measure where the issue is detected.
Fixed
It shows if the issue has been fixed or not.
Ignored
It shows if the issue has been ignored or not.
Expert metrics (Issues)
By clicking on View > Expert View on the page Issues you can visualize the following metrics.
CPU Impact
Potential optimization of CPU compared to other issues. Use this value only to prioritize the issue over other issues for CPU consumption. The CPU impact value is normalized using a normalization factor and the tooltip on the number shows the actual value computed in the analysis.
RAM Impact
Potential optimization of RAM compared to other issues. Use this value only to prioritize the issue over other issues for RAM consumption. The RAM impact value is normalized using a normalization factor and the tooltip on the number shows the actual value computed in the analysis.
Measures metrics
The Measures page regroups the measures of a VPAX model referring to the following metrics.
Relevance
It indicates how relevant is a metric for the model. In other words, it represents the estimated impact of the measure on the overall performance of the model. The relevance value is normalized using a normalization factor and the tooltip on the number shows the actual value computed in the analysis.
Issues
It shows the number of issues detected in the measure.
Exec
It shows how many times the measure is executed in the model. This number is obtained by estimating multiple executions of the measure when it is evaluated in an iterator. The estimation is not necessarily accurate, but it provides a good relative estimate to compare a measure with other measures.
Dir Ref
The direct references metric reports the number of measures that have a direct reference to the measure.
Ind Ref
The indirect references metric reports the number of measures that depend on this measure but do not have a direct reference to it.
Expert metrics (Measures)
By clicking on View > Expert View on the page Measures you can visualize the following metrics.
Issues Impact
The issues impact metric represents the estimated impact of the issues detected on the measure. The estimate is based on relevance, CPU cost, and RAM cost of the code affected by the issue. Use this value to compare the potential optimization of CPU and RAM for issues in the current measure compared to issues in other measures.
Int CPU
Shortcut for Internal CPU %. Percentage of the CPU cost that derives from internal calculations in the measure and does not depend on other referenced measures.
CPU Cost
It represents the estimated CPU cost of the measure inclusive of referenced measures. The value is normalized using a normalization factor reported in the tooltip on the column header. However, the absolute value is not important; use CPU Cost only for relative comparison with other measures.
Int RAM
Shortcut for Internal RAM %. Percentage of the RAM cost that derives from internal calculations in the measure and does not depend on other referenced measures.
RAM Cost
It represents the estimated RAM cost of the measure based on the maximum materialization expected. The value is normalized using a normalization factor reported in the tooltip on the column header. However, the absolute value is not important; use RAM Cost only for relative comparison with other measures.

